June 01, 2026 a 05:15 am

EG: Fibonacci Analysis - Everest Re Group, Ltd.
Everest Re Group, Ltd. has shown resilience in the past few months, even as the insurance and reinsurance industry faces various challenges. Its recent performance indicates a significant uptrend, making it a focus for many investors. The company's strategic moves and diversified offerings position it well for potential growth. However, market volatility and changing regulatory landscapes pose risks.
Fibonacci Analysis
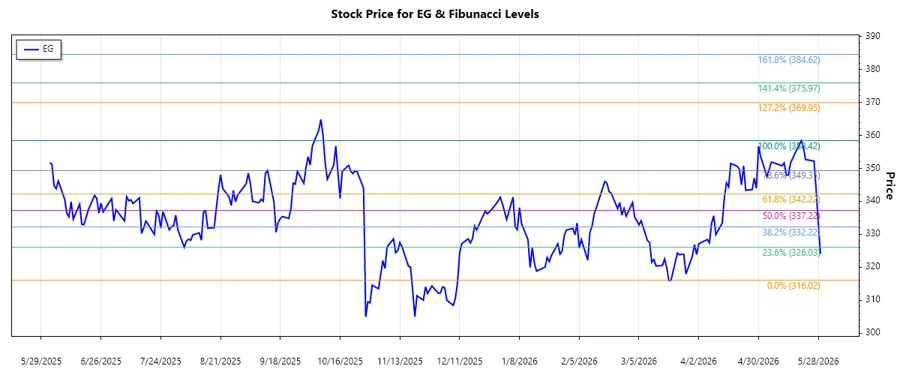
The analysis was conducted on the recent upward trend observed between March 20, 2026, and May 29, 2026. The stock rose from a low of $316.02 on March 20 to a high of $358.42 on May 20. Using these points, we calculate the Fibonacci retracement levels to predict potential support or resistance areas as the stock price moves.
| Parameter | Details |
|---|---|
| Trend Period | March 20, 2026 - May 29, 2026 |
| Low Point | $316.02 (March 20, 2026) |
| High Point | $358.42 (May 20, 2026) |
| Fibonacci Levels |
|
| Current Retracement Zone | 50%: $337.22 |
| Technical Interpretation | The stock currently lies around the 50% retracement zone, indicating a potential area of support that might attract buyers. |
Conclusion
The current analysis of Everest Re Group, Ltd. stock shows significant upward movement over the past months. While approaching the 50% Fibonacci retracement level, it suggests potential support that could help the stock rebound. Investors should monitor the price movement around this critical level. Overall, the company's diversified portfolio and global operations provide growth opportunities. However, regulatory changes and market uncertainty remain areas of concern. Any breach of key retracement levels could influence investor sentiment and impact stock performance.
Smart Data Insight
Master the Perfect Entry & Exit for this Stock
Don't leave your profits to chance. Historically, this stock follows specific seasonal patterns that institutional traders use to maximize returns.
- ✅ Identify the "Golden Buying Window"
- ✅ Avoid high-risk correction cycles
- ✅ Backtested data from the last 20+ years