November 06, 2025 a 06:44 am
EG: Fibonacci Analysis - Everest Re Group, Ltd.
Everest Re Group Ltd. has experienced various market fluctuations over the past months. Recently, the stock shows signs of a recovery, coming from a notable period of decline. This movement has generated interest, as investors are cautiously optimistic about its long-term potential.
Fibonacci Analysis
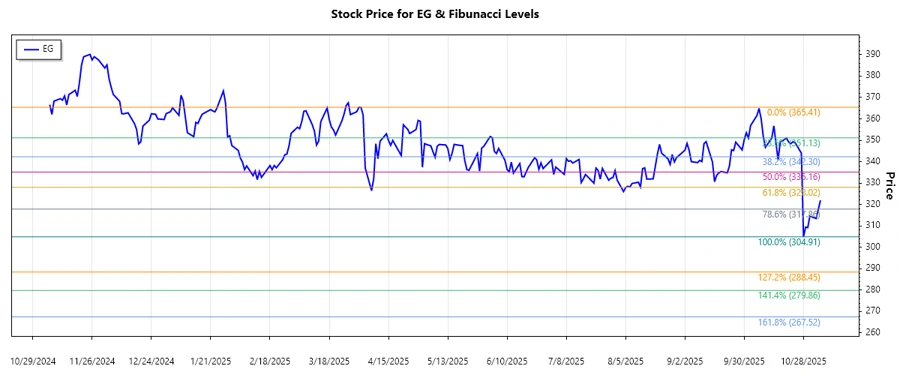
The historical data indicates a dominant downtrend from April 2025 to early November 2025. This downtrend provides a reliable basis for conducting a Fibonacci Retracement analysis. Based on identified high and low, Fibonacci levels have been calculated which might suggest potential reversal zones.
| Metric | Value |
|---|---|
| Start Date | April 1, 2025 |
| End Date | November 5, 2025 |
| High (Price & Date) | $365.41 on April 1, 2025 |
| Low (Price & Date) | $304.91 on October 28, 2025 |
| Fibonacci Level | Price Level |
|---|---|
| 0.236 | $321.46 |
| 0.382 | $330.00 |
| 0.5 | $335.16 |
| 0.618 | $340.32 |
| 0.786 | $348.45 |
As of the last price of $321.99 on November 5, 2025, the stock is currently approaching the 0.236 Fibonacci retracement level, which might signal initial resistance or a point of interest for potential reversals.
The technical interpretation suggests a watchful eye should be kept near the $321.46 level to determine if it will hold as a new support point or if further bearish activity will ensue.
Conclusion
The noted downtrend of Everest Re Group, Ltd's stock suggests that the market has been bearing since early 2025. However, approaching Fibonacci levels provide key insights into potential price reversals. Treading near the 0.236 retracement level hints at possible support, but caution remains as external macroeconomic factors can shift market sentiment. Analysts should consider activating protective strategies or re-evaluating their positions when important technical levels are approached or breached.