May 06, 2026 a 12:46 pm
Dividend Analysis - Everest Re Group, Ltd.
Everest Re Group, Ltd. presents a solid dividend profile featuring a consistent dividend payout history over 32 years, highlighting its reliability in shareholder returns. With a stable dividend yield of 2.50%, the company holds potential for income-focused investors. However, the modest growth rates suggest a conservative approach aimed at long-term sustainability. Despite the low payout ratios, further investment opportunities may evolve if growth accelerates.
Overview 📊
Everest Re Group operates in the insurance sector, maintaining a robust dividend yield of 2.50%. Its current dividend per share stands at $8.09, with a longstanding dividend history of 32 years. The company has not experienced any significant dividend cuts or suspensions in recent times.
| Details | Value |
|---|---|
| Sector | Insurance |
| Dividend yield | 2.50% |
| Current dividend per share | $8.09 |
| Dividend history | 32 years |
| Last cut or suspension | None |
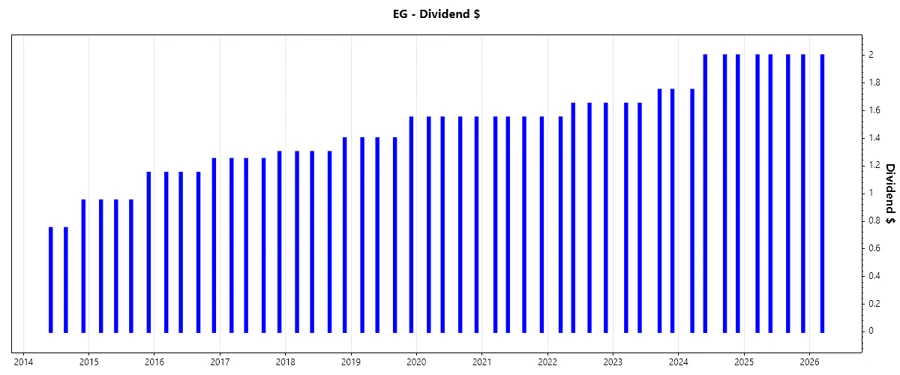
Dividend History 📈
This section details Everest Re's dividend payments, which emphasize consistency and reliability. Such a track record can be a deciding factor for investors seeking dependable income streams.
| Year | Dividend Per Share (USD) |
|---|---|
| 2026 | $8.00 |
| 2025 | $8.00 |
| 2024 | $7.75 |
| 2023 | $6.80 |
| 2022 | $6.50 |
Dividend Growth 📉
Understanding dividend growth rates is critical for evaluating long-term earnings potential. Everest Re's 3-year growth is at 7.17% while the 5-year growth stands at 5.23%, reflecting measured but consistent expansions in shareholder returns.
| Time | Growth |
|---|---|
| 3 years | 7.17% |
| 5 years | 5.23% |
The average dividend growth is 5.23% over 5 years. This shows moderate but steady dividend growth, offering potential for income sustainability.
Payout Ratio ✅
Monitoring payout ratios informs on the sustainability of dividends. Everest Re maintains a conservative EPS-based payout ratio of 16.02% and an FCF-based ratio of 11.27%.
| Key figure | Ratio |
|---|---|
| EPS-based | 16.02% |
| Free cash flow-based | 11.27% |
The low payout ratios suggest ample room for continued dividends and potential reinvestment into the business for future growth.
Cashflow & Capital Efficiency 🗣️
Free Cash Flow and capital efficiency metrics, such as FCF yield and operating cash flow ratios, provide insights into a company's ability to sustain and grow dividends.
| Metric | 2023 | 2024 | 2025 |
|---|---|---|---|
| Free Cash Flow Yield | 31.18% | 32.03% | 24.21% |
| Earnings Yield | 17.24% | 8.87% | 11.32% |
| CAPEX to Operating Cash Flow | 0% | 0% | 0% |
| Stock-based Compensation to Revenue | 0.34% | 0.37% | 0.35% |
| Free Cash Flow / Operating Cash Flow Ratio | 100% | 100% | 100% |
The consistent Free Cash Flow / Operating Cash Flow Ratio over recent years underlines sustained cash generation supporting capital allocation priorities.
Balance Sheet & Leverage Analysis
Debt-to-capital metrics, net debt to EBITDA, and current liquidity ratios shed light on financial health. Everest Re exhibits prudent leverage management, as seen in its strong current ratio and low debt ratios.
| Metric | 2023 | 2024 | 2025 |
|---|---|---|---|
| Debt-to-Equity | 43.44% | 42.79% | 23.21% |
| Debt-to-Assets | 11.61% | 10.54% | 5.74% |
| Debt-to-Capital | 30.28% | 29.97% | 18.84% |
| Net Debt to EBITDA | 1.88x | 2.67x | 1.10x |
| Current Ratio | 0.74 | 0.78 | 0.76 |
| Quick Ratio | 0.74 | 0.78 | 0.76 |
| Financial Leverage | 3.74 | 4.06 | 4.04 |
Prudent uses of leverage and higher liquidity position offer robust stability against financial uncertainties.
Fundamental Strength & Profitability 📊
Fundamental performance metrics like ROE, ROA, and profit margins provide insight into operating efficiency and profitability. Everest Re shows strong returns on equity, indicating effective management of shareholder funds.
| Metric | 2023 | 2024 | 2025 |
|---|---|---|---|
| Return on Equity | 19.07% | 9.89% | 10.29% |
| Return on Assets | 5.10% | 2.44% | 2.55% |
| Margins: Net | 17.40% | 8.04% | 9.19% |
| Margins: EBIT | 15.82% | 9.62% | 11.94% |
| Margins: EBITDA | 15.82% | 9.62% | 11.94% |
| Margins: Gross | 21.33% | 14.47% | 20.52% |
| R&D to Revenue | 0% | 0% | 0% |
Everest Re's robust ROE and consistent margins underscore its profitability and competitive advantage within the sector.
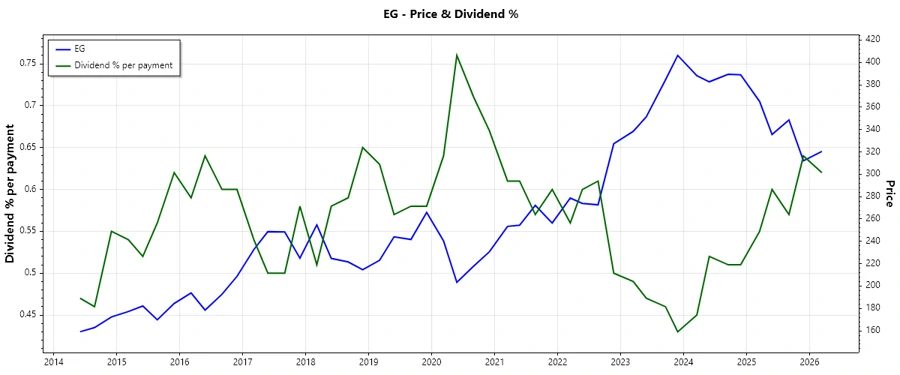
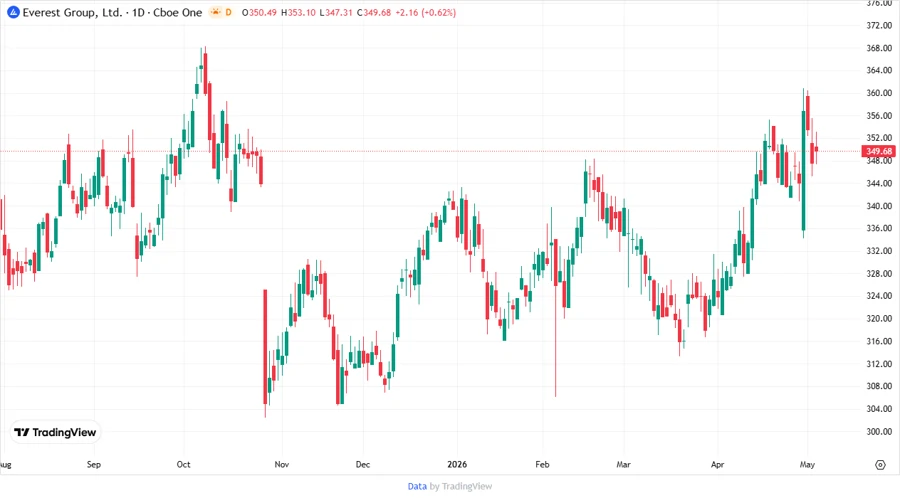
Price Development 🗣️
Dividend Scoring System
| Criteria | Score | Score Bar |
|---|---|---|
| Dividend yield | 3 | |
| Dividend Stability | 5 | |
| Dividend growth | 3 | |
| Payout ratio | 5 | |
| Financial stability | 4 | |
| Dividend continuity | 5 | |
| Cashflow Coverage | 5 | |
| Balance Sheet Quality | 4 |
Total Score: 34/40
Rating
Everest Re Group, Ltd. holds a strong dividend profile with stable historical payouts, low payout ratios, and prudent financial management. For investors seeking stable income, this stock remains a recommended choice. Ratings indicate sound financial health and long-term potential in dividend growth.
Smart Data Insight
Master the Perfect Entry & Exit for this Stock
Don't leave your profits to chance. Historically, this stock follows specific seasonal patterns that institutional traders use to maximize returns.
- ✅ Identify the "Golden Buying Window"
- ✅ Avoid high-risk correction cycles
- ✅ Backtested data from the last 20+ years