January 07, 2026 a 07:31 am


📊 Dividend Analysis - Everest Re Group, Ltd.
Everest Re Group, Ltd. demonstrates a solid dividend profile with a robust history of 31 consecutive years of payments. With a current dividend yield of approximately 2.56%, the company's commitment to shareholder returns is evident. Their strategic financial management reflects stability with no recent interruptions, showcasing resilience in dividend policies. This analysis will provide further insights into their dividend strategy and its implications for long-term investors.
Overview
Everest Re Group, Ltd., operating in the insurance sector, maintains a healthy dividend yield of 2.56%, with a current dividend of $7.82 per share. The company's uninterrupted 31-year dividend history highlights its dedication to consistent shareholder returns.
| Description | Details |
|---|---|
| Sector | Insurance |
| Dividend yield | 2.56% |
| Current dividend per share | $7.82 |
| Dividend history | 31 years |
| Last cut or suspension | None |
Dividend History
The unwavering 31-year dividend history of Everest Re Group illustrates a strong commitment to its shareholders. Consistent dividend payments indicate a stable financial backing, essential for income-focused investors.
| Year | Dividend per Share (USD) |
|---|---|
| 2025 | 8.00 |
| 2024 | 7.75 |
| 2023 | 6.80 |
| 2022 | 6.50 |
| 2021 | 6.20 |
Dividend Growth
Evaluating the growth of dividends provides insight into a company's future payout capacity. Everest Re Group's dividend growth rates over the past three and five years are indicative of gradual progress.
| Time | Growth |
|---|---|
| 3 years | 7.17% |
| 5 years | 5.23% |
The average dividend growth is 5.23% over 5 years. This shows moderate but steady dividend growth, aligning with conservative income growth expectations.
Payout Ratio
Payout ratios are crucial to understanding how sustainably a company can continue its dividend payments. They reflect the portion of earnings and cash flow allocated to dividends.
| Key figure | Ratio |
|---|---|
| EPS-based | 59.33% |
| Free cash flow-based | 7.73% |
The 59.33% EPS-based payout ratio is comfortably contained, suggesting a stable balance between return distributions and earnings retention for growth. The FCF-based ratio of 7.73% indicates ample cushion to support future dividends even if earnings fluctuate.
Cashflow & Capital Efficiency
Cashflow efficiency ratios provide a deep dive into the core financial operations impacting dividend stability and future growth potential. Here are some key metrics:
| Metric | 2024 | 2023 | 2022 |
|---|---|---|---|
| Free Cash Flow Yield | 32.03% | 31.18% | 28.60% |
| Earnings Yield | 8.87% | 17.24% | 4.62% |
| CAPEX / Operating Cash Flow | 0% | 0% | 0% |
| Stock-based Compensation / Revenue | 0.37% | 0.34% | 0.38% |
| FCF / Operating Cash Flow Ratio | 1 | 1 | 1 |
These metrics display strong cash flow management and capital deployment efficiency, reinforcing Everest Re Group's capacity to sustain dividend payouts and fund its operations.
Balance Sheet & Leverage Analysis
A prudent leverages analysis is essential for assessing financial solvency and the risk profile related to dividend distributions.
| Metric | 2024 | 2023 | 2022 |
|---|---|---|---|
| Debt-to-Equity | 0.43 | 0.43 | 0.64 |
| Debt-to-Assets | 0.10 | 0.12 | 0.14 |
| Debt-to-Capital | 0.30 | 0.30 | 0.39 |
| Net Debt to EBITDA | 2.67 | 1.88 | 5.85 |
| Current Ratio | 0 | 0 | 10.63 |
| Quick Ratio | 0 | 0 | 13.39 |
| Financial Leverage | 4.06 | 3.74 | 4.73 |
The leverage ratios suggest Everest Re Group maintains a conservative debt management strategy with substantial financial stability. A higher degree of leverage could be translated into more risk, but in this case, it remains within reasonable boundaries for sustainable operations.
Fundamental Strength & Profitability
Fundamentals are pivotal for ensuring long-term viability and investor confidence, thus impacting dividend policies significantly.
| Metric | 2024 | 2023 | 2022 |
|---|---|---|---|
| Return on Equity | 9.89% | 19.06% | 7.07% |
| Return on Assets | 2.44% | 5.10% | 1.49% |
| Net Margin | 8.04% | 17.40% | 4.98% |
| EBIT Margin | 9.62% | 15.82% | 5.75% |
| EBITDA Margin | 9.62% | 15.82% | 5.75% |
| Gross Margin | 14.47% | 21.33% | 11.32% |
| R&D / Revenue | 0% | 0% | 0% |
Everest Re Group showcases solid profitability metrics with consistent ROE and asset returns. Their strategic alignment towards profitability ensures the sustainability of its dividend scheduling efforts.
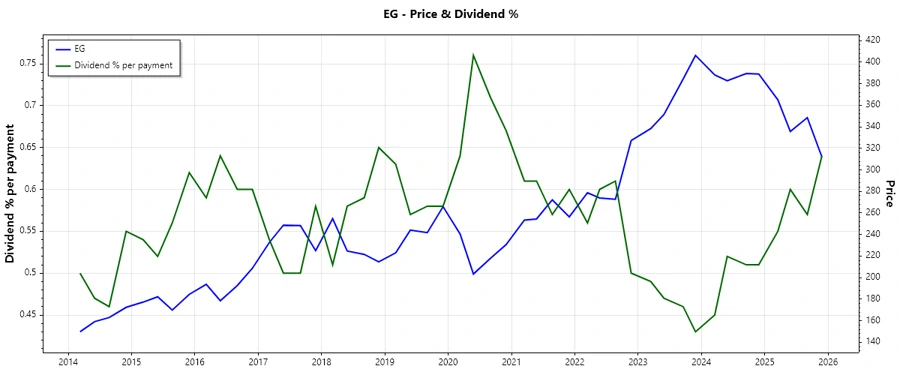
Price Development
Dividend Scoring System
| Category | Details | Score |
|---|---|---|
| Dividend yield | Good, stable percentage | 3.5 |
| Dividend Stability | High historical stability | 4.5 |
| Dividend growth | Moderate & steady growth | 3 |
| Payout ratio | Solid payout control | 4 |
| Financial stability | Low-risk leverage | 4 |
| Dividend continuity | 31 years uninterrupted | 5 |
| Cashflow Coverage | Consistent coverage | 4.5 |
| Balance Sheet Quality | Robust and solid | 3.5 |
Overall Score: 32/40
Rating
Everest Re Group presents a compelling investment case with strong dividend fundamentals and a high degree of financial stability. Investors seeking consistent income along with moderate growth prospects will likely find the company aligns well with their portfolio objectives.