January 06, 2026 a 02:46 am

EG: Dividend Analysis - Everest Re Group, Ltd.
Everest Re Group, Ltd., a prominent player in its sector, boasts a robust dividend profile that deserves attention from dividend-focused investors. With a lengthy dividend history spanning 31 years and a commendable dividend yield, this firm exemplifies consistency and stability in shareholder returns. Despite modest growth in recent years, Everest Re's dividends present a reliable income stream, further bolstered by the absence of any recent cuts or suspensions.
📊 Overview
The overview of Everest Re Group’s dividend profile highlights its strong presence in the industry. Notably, the company has maintained a stable dividend yield of 2.56%, with the current dividend per share standing at $7.82. This consistency is further reinforced by a 31-year history of uninterrupted dividend payments, with no cuts or suspensions in recent times. Such performance emphasizes the firm's commitment to rewarding its shareholders over time.
| Metric | Value |
|---|---|
| Sector | Insurance |
| Dividend Yield | 2.56% |
| Current Dividend per Share | $7.82 |
| Dividend History | 31 years |
| Last Cut or Suspension | None |
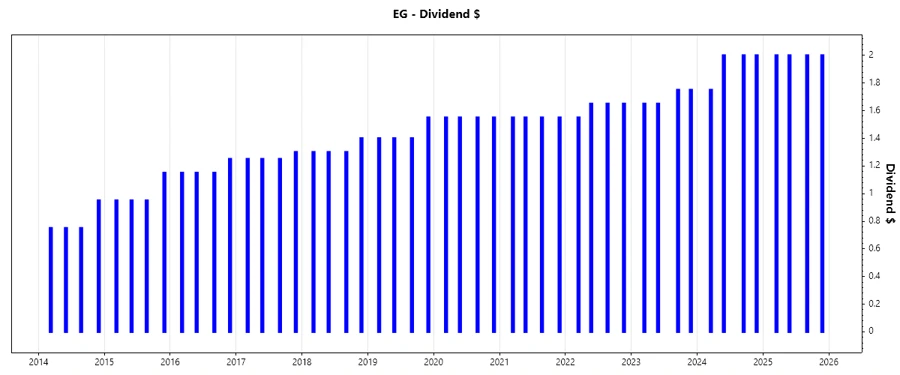
🗣️ Dividend History
An analysis of Everest Re Group’s dividend history reveals a decade-long tradition of rewarding its shareholders consistently. This track record is crucial for those seeking regular income and provides confidence in the company's ongoing commitment to its dividend policy.
| Year | Dividend per Share (USD) |
|---|---|
| 2025 | $8.00 |
| 2024 | $7.75 |
| 2023 | $6.80 |
| 2022 | $6.50 |
| 2021 | $6.20 |
📈 Dividend Growth
Everest Re Group’s dividend growth over the last three and five years demonstrates a strategic approach to gradually increasing shareholder returns. These increments indicate management's focus on sustainable growth, ensuring dividends don't outpace company earnings or cash flow capabilities.
| Time | Growth (%) |
|---|---|
| 3 years | 7.17% |
| 5 years | 5.23% |
The average dividend growth is 5.23% over 5 years. This shows moderate but steady dividend growth.
✅ Payout Ratio
The payout ratio provides insights into the sustainability of Everest Re Group’s dividend distributions. Notably, the EPS-based payout ratio is 59.33%, while the Free Cash Flow-based payout ratio is a low 7.73%. These figures suggest that the company's dividend policy is well-aligned with its earnings, ensuring dividends are both sustainable and adequately covered by cash flow.
| Key Figure | Ratio |
|---|---|
| EPS-based | 59.33% |
| Free Cash Flow-based | 7.73% |
The EPS-based ratio is manageable, ensuring the dividend is sustainable, while the FCF-based ratio shows a strong ability to cover the dividend, indicating a healthy financial state.
⚙️ Cashflow & Capital Efficiency
The examination of cash flow and capital efficiency ratios gives a comprehensive picture of Everest's operational performance. The company maintains a substantial free cash flow yield and earnings yield, indicating strong cash conversion and profitability.
| Metric | 2022 | 2023 | 2024 |
|---|---|---|---|
| Free Cash Flow Yield | 28.60% | 31.18% | 32.02% |
| Earnings Yield | 4.62% | 17.24% | 8.87% |
| CAPEX to Operating Cash Flow | 0% | 0% | 0% |
| Stock-based Compensation to Revenue | 0.38% | 0.34% | 0.37% |
| Free Cash Flow / Operating Cash Flow Ratio | 100% | 100% | 100% |
Overall, Everest Re Group showcases excellent cash flow stability and efficiency, leveraging its capital effectively without tying up resources unnecessarily.
⚠️ Balance Sheet & Leverage Analysis
The analysis of Everest’s balance sheet and leverage ratios is crucial for understanding its financial robustness. The company's debt ratios remain manageable, indicating a balanced approach to leveraging that supports growth without overexposure to volatility.
| Metric | 2022 | 2023 | 2024 |
|---|---|---|---|
| Debt-to-Equity | 0.64 | 0.43 | 0.43 |
| Debt-to-Assets | 0.14 | 0.12 | 0.11 |
| Debt-to-Capital | 0.39 | 0.30 | 0.30 |
| Net Debt to EBITDA | 5.85 | 1.88 | 2.67 |
| Current Ratio | 10.63 | 0 | 0 |
| Quick Ratio | 13.39 | 0 | 0 |
| Financial Leverage | 4.73 | 3.74 | 4.06 |
Everest’s leverage position remains controlled, ensuring financial stability and low risk of insolvency through prudent use of debt relative to equity and assets.
🏆 Fundamental Strength & Profitability
Fundamentals and profitability metrics are key to evaluating Everest’s intrinsic value creation. The firm exhibits strong returns on equity and assets, alongside robust margins that reflect its competitive advantage and operational efficiency.
| Metric | 2022 | 2023 | 2024 |
|---|---|---|---|
| Return on Equity | 7.07% | 19.07% | 9.89% |
| Return on Assets | 1.49% | 5.10% | 2.44% |
| Net Margin | 4.98% | 17.40% | 8.04% |
| EBIT Margin | 5.75% | 15.82% | 9.62% |
| EBITDA Margin | 5.75% | 15.82% | 9.62% |
| Gross Margin | 11.32% | 21.33% | 14.47% |
| R&D to Revenue | 0% | 0% | 0% |
Overall, Everest Re Group demonstrates exemplary profitability metrics, testifying to its operational excellence and ability to maintain a competitive edge.
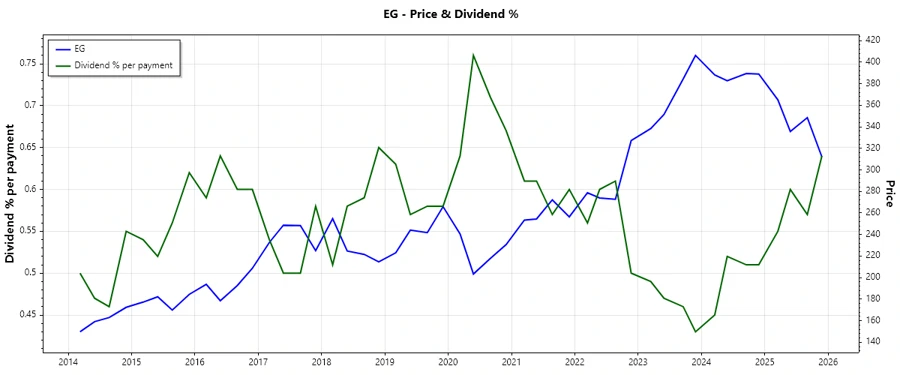
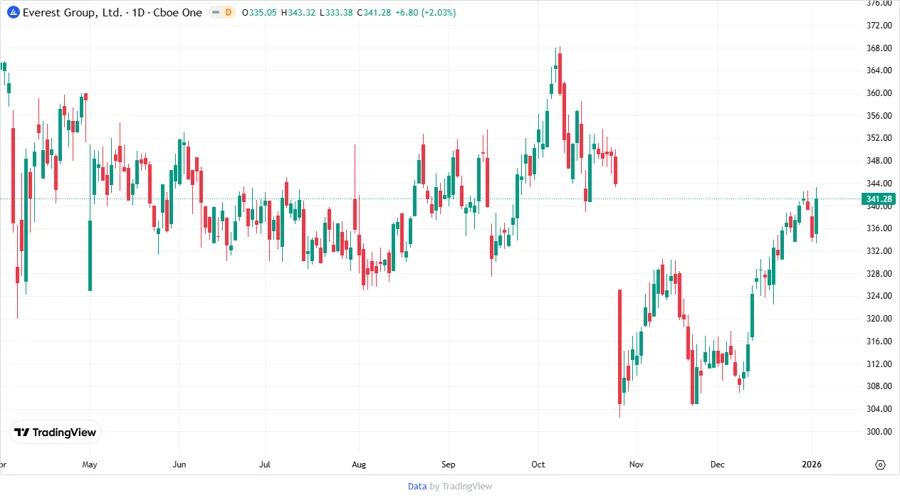
📉 Price Development
🎯 Dividend Scoring System
| Criteria | Score | Bar |
|---|---|---|
| Dividend Yield | 4 | |
| Dividend Stability | 5 | |
| Dividend Growth | 3 | |
| Payout Ratio | 4 | |
| Financial Stability | 4 | |
| Dividend Continuity | 5 | |
| Cashflow Coverage | 5 | |
| Balance Sheet Quality | 4 |
Total Score: 34/40
⭐ Rating
Overall, Everest Re Group, Ltd. maintains a commendable dividend strategy marked by stability, sustainability, and moderate growth, making it a viable option for income-focused investors. With robust financial metrics supporting its dividend policy, the firm illustrates a commitment to rewarding shareholders consistently. Investors are encouraged to consider Everest Re as a praiseworthy addition to a well-diversified income portfolio.