October 28, 2025 a 03:31 pm

EG: Dividend Analysis - Everest Re Group, Ltd.
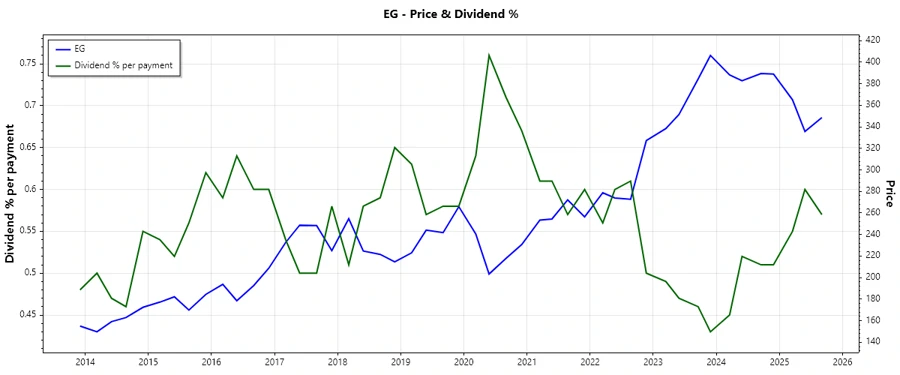
The dividend profile of Everest Re Group, Ltd. signals a resilient and promising investment opportunity. With over 31 years of stable dividend history and recent growth, the company maintains a steady commitment to its shareholders. The dividend yield remains competitive within its sector, reflecting an appealing income stream for potential investors.
📊 Overview
Everest Re Group, Ltd. offers consistent dividends supported by a robust financial background and a reliable commitment to shareholder returns.
| Key Metrics | Value |
|---|---|
| Sector | Insurance |
| Dividend Yield | 2.30% |
| Current Dividend Per Share | $7.82 USD |
| Dividend History | 31 years |
| Last Cut or Suspension | None |
🗣️ Dividend History
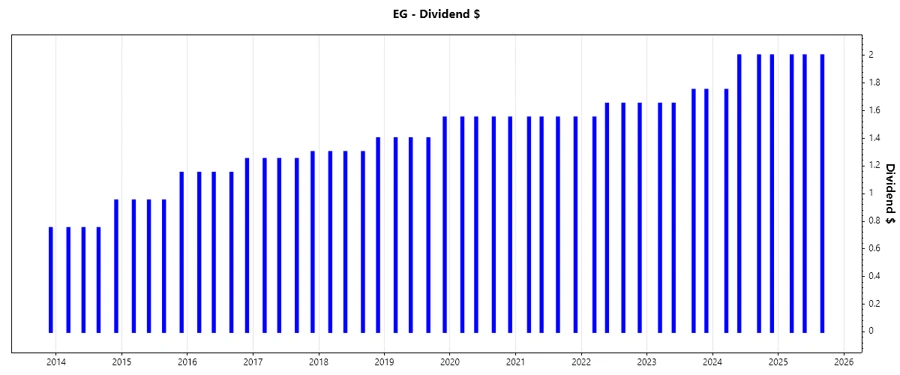
With 31 uninterrupted years of dividend payouts, Everest Re Group demonstrates reliability in returning value to its shareholders, signaling financial strength and consistent profit generation.
| Year | Dividend Per Share (USD) |
|---|---|
| 2025 | 6.00 |
| 2024 | 7.75 |
| 2023 | 6.80 |
| 2022 | 6.50 |
| 2021 | 6.20 |
📈 Dividend Growth
Moderate growth over the last 5 years indicates a sustainable dividend strategy. This growth provides assurance of stable returns for investors seeking income.
| Time | Growth |
|---|---|
| 3 years | 7.72% |
| 5 years | 6.15% |
The average dividend growth is 6.15% over 5 years. This shows moderate but steady dividend growth.
✅ Payout Ratio
The EPS payout ratio is 60.3%, indicating a balanced approach to dividend distribution and retaining earnings for growth. The FCF-based payout ratio at 7.73% suggests ample cash flow back-up.
| Key Figure | Ratio |
|---|---|
| EPS-based | 60.29% |
| Free Cash Flow-based | 7.73% |
💰 Cashflow & Capital Efficiency
Estimating the cash flow efficiency, Everest Re Group's financial metrics reflect its capability to cover dividends while investing in growth. The leverage utilization ensures operational flexibility.
| Metric | 2024 | 2023 | 2022 |
|---|---|---|---|
| Free Cash Flow Yield | 32.03% | 31.18% | 28.60% |
| Earnings Yield | 8.87% | 17.24% | 4.62% |
| CAPEX to Operating Cash Flow | 0% | 0% | 0% |
| Stock-based Compensation to Revenue | 0.37% | 0.34% | 0.38% |
| Free Cash Flow / Operating Cash Flow Ratio | 1 | 1 | 1 |
📉 Balance Sheet & Leverage Analysis
Everest Re Group maintains a robust balance sheet, ensuring liquidity and controlled financial leverage. Debt ratios are kept at manageable levels, reinforcing financial stability.
| Metric | 2024 | 2023 | 2022 |
|---|---|---|---|
| Debt-to-Equity | 0.43 | 0.43 | 0.64 |
| Debt-to-Assets | 0.11 | 0.12 | 0.14 |
| Debt-to-Capital | 0.30 | 0.30 | 0.39 |
| Net Debt to EBITDA | 2.67 | 1.88 | 5.85 |
| Current Ratio | - | - | 10.63 |
| Quick Ratio | 14.42 | 0.43 | 13.39 |
| Financial Leverage | 4.06 | 3.74 | 4.73 |
📈 Fundamental Strength & Profitability
Examining the profitability, Everest Re Group shows noteworthy performance, bolstered by its robust margin structure and healthy return on equity. These fundamentals underscore operational efficacy.
| Metric | 2024 | 2023 | 2022 |
|---|---|---|---|
| Return on Equity | 9.89% | 19.07% | 7.07% |
| Return on Assets | 2.44% | 5.10% | 1.49% |
| Margins: Net | 8.04% | 17.40% | 4.98% |
| EBIT | 9.62% | 15.82% | 5.75% |
| EBITDA | 9.62% | 15.82% | 5.75% |
| Gross | 33.80% | 41.74% | 32.42% |
| Research & Development to Revenue | 0% | 0% | 0% |
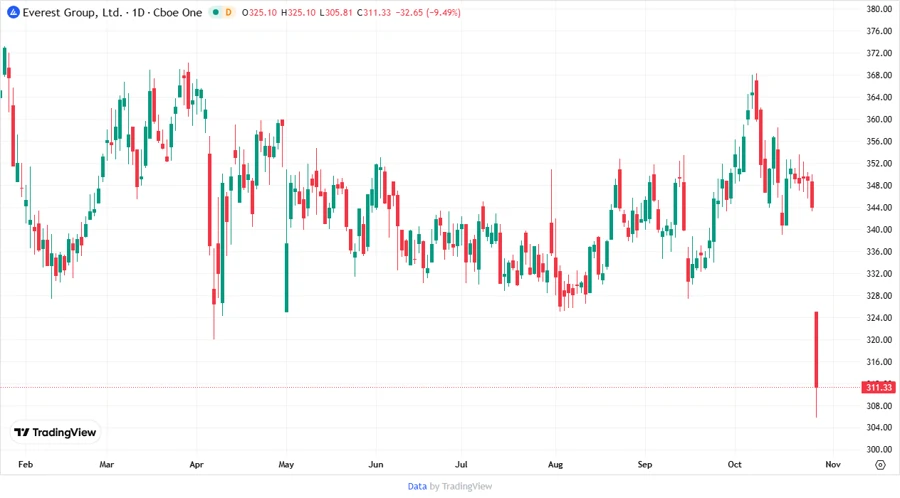
📈 Price Development
🔍 Dividend Scoring System
| Category | Score | Score Bar |
|---|---|---|
| Dividend Yield | 4/5 | |
| Dividend Stability | 5/5 | |
| Dividend Growth | 4/5 | |
| Payout Ratio | 4/5 | |
| Financial Stability | 5/5 | |
| Dividend Continuity | 5/5 | |
| Cashflow Coverage | 4/5 | |
| Balance Sheet Quality | 3/5 |
Overall Score: 34/40
⭐ Rating
In summary, Everest Re Group, Ltd. showcases a compelling dividend investment case with its solid growth record, robust financial health, and consistent yield. It remains a strong prospect for income-focused investors seeking stability and reasonable growth potential.
Smart Data Insight
Master the Perfect Entry & Exit for this Stock
Don't leave your profits to chance. Historically, this stock follows specific seasonal patterns that institutional traders use to maximize returns.
- ✅ Identify the "Golden Buying Window"
- ✅ Avoid high-risk correction cycles
- ✅ Backtested data from the last 20+ years