August 14, 2025 a 12:46 pm
📊 Dividend Analysis - Everest Re Group, Ltd.
Everest Re Group, Ltd. stands out for its steadfast commitment to delivering consistent shareholder returns through stable dividend payouts. With a solid history bolstered by sustained growth, the company’s strategic focus on enhancing its financial base and optimizing operations has fortified its position as a dividend stalwart. This analysis delves into the key facets that shape Everest Re Group, Ltd.'s dividend profile.
🗣️ Overview
Everest Re Group, Ltd., operating in the insurance sector, has demonstrated a robust dividend profile characterized by a consistent 31-year history of dividend payments. With a current dividend yield of 2.38% and a dividend per share standing at 7.82 USD, their history of no recent cuts underscores a reliable income stream for investors.
| Metric | Value |
|---|---|
| Sector | Insurance |
| Dividend yield | 2.38% |
| Current dividend per share | 7.82 USD |
| Dividend history | 31 years |
| Last cut or suspension | None |
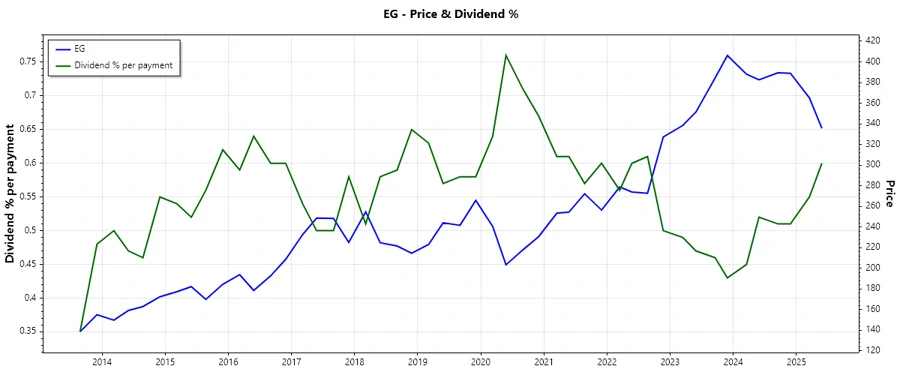
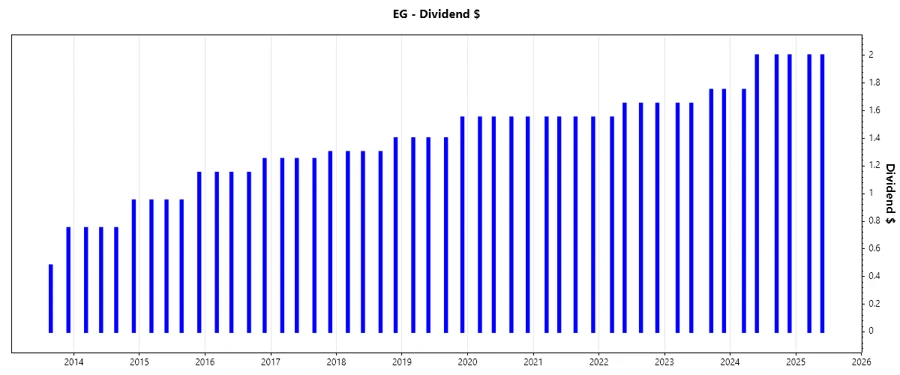
📈 Dividend History
The company's dividend history is a testament to its reliable payout strategy. A glance at the last five years highlights a gradual increase in payouts, showcasing resilience even amidst economic fluctuations.
| Year | Dividend per Share (USD) |
|---|---|
| 2025 | 4.00 |
| 2024 | 7.75 |
| 2023 | 6.80 |
| 2022 | 6.50 |
| 2021 | 6.20 |
📈 Dividend Growth
Dividend growth is pivotal for income investors seeking both yield and capital appreciation. Everest Re Group, Ltd. has shown a promising dividend growth of 7.72% over three years and 6.15% over five years.
| Time | Growth |
|---|---|
| 3 years | 7.72% |
| 5 years | 6.15% |
The average dividend growth is 6.15% over 5 years. This shows moderate but steady dividend growth, underpinning the company’s commitment to rewarding shareholders.
⚖️ Payout Ratio
The payout ratio is a crucial indicator of dividend sustainability. Everest Re Group, Ltd. maintains a conservative EPS-based payout ratio of 41.41% and a FCF-based ratio at 7.25%, indicating ample room to sustain its payouts amidst earnings variations.
| Key figure | Ratio |
|---|---|
| EPS-based | 41.41% |
| Free cash flow-based | 7.25% |
These figures suggest Everest Re Group, Ltd. has adopted a disciplined approach, balancing reinvestment with generous shareholder returns.
🏦 Cashflow & Capital Efficiency
Analyzing cash flows provides insight into the firm's operational efficiency and its ability to finance dividends. Everest Re Group, Ltd. exhibits stable free cash flow yields, effective earnings yields, and prudent capital spending relative to cash flow.
| Metric | 2022 | 2023 | 2024 |
|---|---|---|---|
| Free Cash Flow Yield | 28.60% | 31.18% | 32.03% |
| Earnings Yield | 4.62% | 17.24% | 8.87% |
| CAPEX to Operating Cash Flow | 0% | 0% | 0% |
| Stock-based Compensation to Revenue | 0.38% | 0.34% | 0.37% |
| Free Cash Flow / Operating Cash Flow Ratio | 1 | 1 | 1 |
These robust cash flow metrics signal strong financial health and operational efficiency, vital for dividend sustainability.
🗃️ Balance Sheet & Leverage Analysis
The strength of a balance sheet is pivotal in assessing a company's capacity to meet its obligations and sustain dividends through economic cycles. Everest Re Group, Ltd. showcases prudent leverage ratios and strong liquidity positions.
| Metric | 2022 | 2023 | 2024 |
|---|---|---|---|
| Debt-to-Equity | 36.54% | 25.81% | 26.76% |
| Debt-to-Assets | 7.72% | 6.90% | 6.59% |
| Debt-to-Capital | 26.76% | 20.52% | 21.11% |
| Net Debt to EBITDA | N/A | -83.87 | 1.20 |
| Current Ratio | 10.63 | 0.43 | 14.42 |
| Quick Ratio | 13.39 | 0.43 | 14.42 |
| Financial Leverage | 4.73 | 3.74 | 4.06 |
Equipped with a conservative debt structure and ample liquidity, Everest Re Group, Ltd. is well-positioned to weather financial challenges, maintaining its dividend commitments.
🔍 Fundamental Strength & Profitability
Understanding fundamental and profitability metrics helps gauge a company's operational effectiveness and its potential for sustainable dividend payments.
| Metric | 2022 | 2023 | 2024 |
|---|---|---|---|
| Return on Equity | 7.07% | 19.07% | 9.89% |
| Return on Assets | 1.49% | 5.10% | 2.44% |
| Net Margin | 4.98% | 17.25% | 8.04% |
| EBIT Margin | 5.75% | 15.69% | 9.62% |
| EBITDA Margin | 0% | -0.16% | 10.59% |
| Gross Margin | 100% | 41.39% | 8.98% |
| Research & Development to Revenue | 0% | 0% | 0% |
The company’s profitability metrics reflect a resilient operational framework, crucial for consistent dividend distributions.
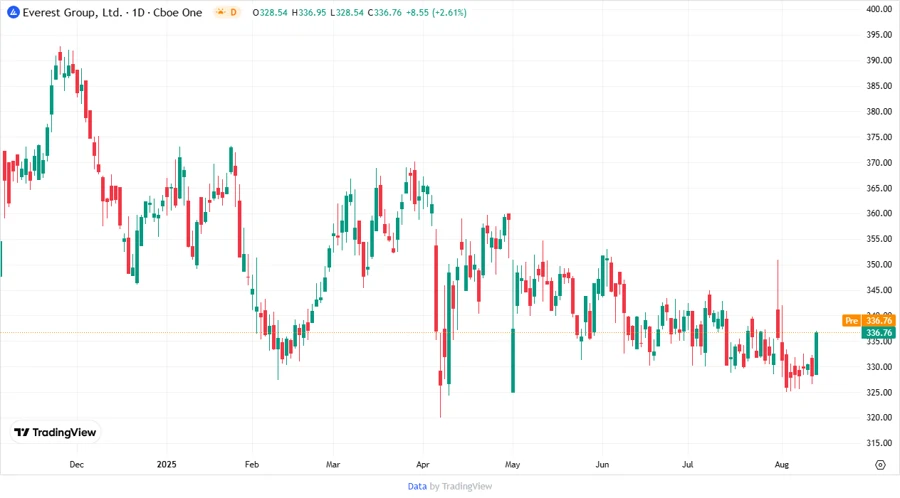
📉 Price Development
✅ Dividend Scoring System
| Criteria | Score | Score Indicator |
|---|---|---|
| Dividend yield | 4 | |
| Dividend Stability | 5 | |
| Dividend Growth | 4 | |
| Payout Ratio | 5 | |
| Financial Stability | 5 | |
| Dividend Continuity | 5 | |
| Cashflow Coverage | 5 | |
| Balance Sheet Quality | 5 |
Total Score: 38/40
🔍 Rating
In conclusion, Everest Re Group, Ltd. maintains a strong dividend profile with commendable growth and stability metrics, making it a compelling choice for dividend-focused investors seeking consistent income and potential price appreciation.
Smart Data Insight
Master the Perfect Entry & Exit for this Stock
Don't leave your profits to chance. Historically, this stock follows specific seasonal patterns that institutional traders use to maximize returns.
- ✅ Identify the "Golden Buying Window"
- ✅ Avoid high-risk correction cycles
- ✅ Backtested data from the last 20+ years