
July 21, 2026 a 09:03 amEFX: Trend and Support & Resistance Analysis - Equifax Inc.
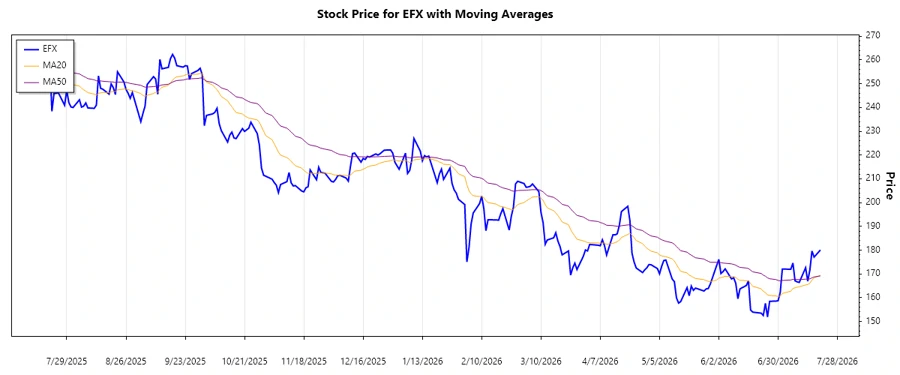
The analysis of Equifax Inc. (Ticker: EFX) indicates complex market movements over recent months. The company has a rich business environment focusing on data, analytics, and various solutions, making it sensitive to various economic shifts. The trend has shown some volatility, posing opportunities as well as risks. By analyzing the EMA20 and EMA50 alongside support and resistance levels, we can gain insights into potential future movements. Overall, EFX remains attractive for those who can navigate market fluctuations.
Trend Analysis
The examination of EFX's price data suggests fluctuations with periodic uptrends and downtrends. Calculating the EMA20 and EMA50 from the close prices provides insights into the prevailing trend. Using EMA calculations:
| Date | Close Price | Trend | Indicator |
|---|---|---|---|
| 2026-07-20 | $180.08 | ▼ Abwärtstrend | ⬇️ |
| 2026-07-17 | $177.08 | ▼ Abwärtstrend | ⬇️ |
| 2026-07-16 | $179.62 | ▼ Abwärtstrend | ⬇️ |
| 2026-07-15 | $171.61 | ▼ Abwärtstrend | ⬇️ |
| 2026-07-14 | $166.93 | ▼ Abwärtstrend | ⬇️ |
| 2026-07-13 | $172.61 | ▼ Abwärtstrend | ⬇️ |
| 2026-07-10 | $166.44 | ▼ Abwärtstrend | ⬇️ |
With EMA20 < EMA50, the current indication is a downward trend. This suggests caution but also potential for rebound opportunities if critical resistance levels are approached. Analyzing broader patterns alongside these indicators helps reinforce strategic entries and exits.
Support and Resistance
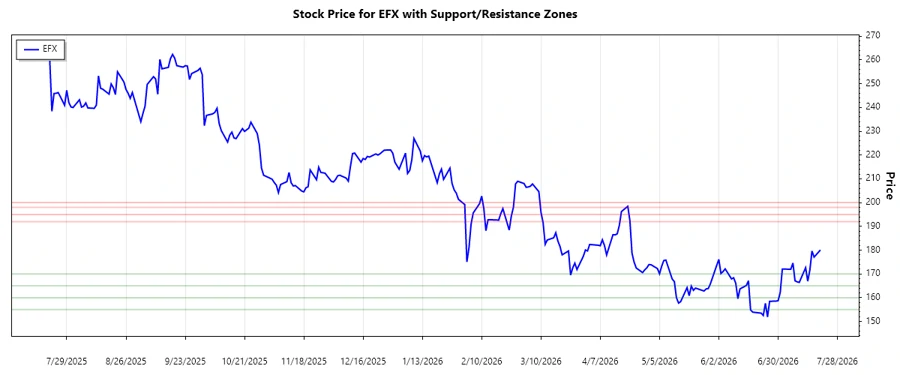
Based on historical price data, we identify the following support and resistance zones. These can provide strategic inflection points for trader actions. Calculations predict the zones as follows:
| Type | From | To | Indicator |
|---|---|---|---|
| Resistance Zone 1 | $198 | $200 | 🔺 |
| Resistance Zone 2 | $192 | $195 | 🔺 |
| Support Zone 1 | $165 | $170 | 🔻 |
| Support Zone 2 | $155 | $160 | 🔻 |
The current price is closer to the lower support zone, suggesting that immediate action might involve observing any strengthening as it approaches these levels for a potential upside. Monitoring interactions with these zones can confirm future short-term trends.
Conclusion
The Equifax Inc. stock is exhibiting a downward trend, as seen with recent EMA analysis. However, historical support levels suggest possible stability or reversal opportunities. Investors should weigh these dynamics, considering both the company's expansive analytical services and the prevailing market conditions. The stock remains a viable option for strategic long-term holds or tactical plays based on resistance and support. Awareness of economic indicators influencing its business sectors will be advantageous for maximizing returns or mitigating potential risks. Continued assessment of EMA behaviors will be critical in predicting further stock movements.
Smart Data Insight
Master the Perfect Entry & Exit for this Stock
Don't leave your profits to chance. Historically, this stock follows specific seasonal patterns that institutional traders use to maximize returns.
- ✅ Identify the "Golden Buying Window"
- ✅ Avoid high-risk correction cycles
- ✅ Backtested data from the last 20+ years