
July 16, 2026 a 04:44 pm
EFX: Fibonacci Analysis - Equifax Inc.
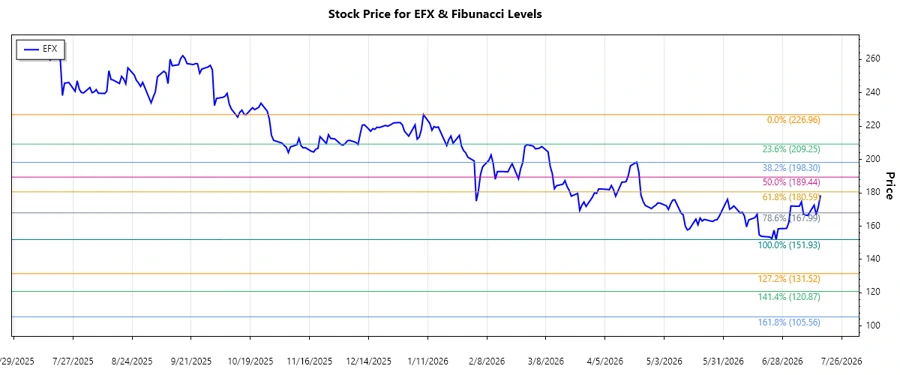
Equifax Inc. has been showing significant volatility in its stock price, making it an interesting candidate for technical analysis. The recent trend identified in the stock is a bearish downtrend, which started in January 2026 and extends up to July 2026. This period has seen Equifax's stock price declining from a high of $226.96 down to a lower value, providing opportunities for retracement analysis and identifying potential support levels.
Fibonacci Analysis
| Start Date | End Date | High Price (Date) | Low Price (Date) |
|---|---|---|---|
| 2026-01-09 | 2026-07-16 | $226.96 (2026-01-09) | $151.93 (2026-06-25) |
Fibonacci Retracement Levels
| Level | Price |
|---|---|
| 0.236 | $170.25 |
| 0.382 | $178.95 |
| 0.5 | $184.45 |
| 0.618 | $189.94 |
| 0.786 | $198.17 |
The current price of $178.515 is close to the 0.382 retracement level, indicating potential support/resistance in this region. This suggests that traders might expect a reversal or further consolidation around this point. It is essential to keep an eye on whether the price bounces off this level or breaks through.
Conclusion
The analysis of Equifax Inc. (EFX) reveals a significant downtrend starting in early 2026. The current price seems to be testing the 0.382 Fibonacci retracement level, which could act as a support or resistance area based on further market sentiments. The key risk for investors is the potential continuation of bearish momentum, but there are opportunities for short-term bullish reversals at critical retracement levels. Investors should consider these technical insights alongside fundamental analysis and broader market conditions.
Smart Data Insight
Master the Perfect Entry & Exit for this Stock
Don't leave your profits to chance. Historically, this stock follows specific seasonal patterns that institutional traders use to maximize returns.
- ✅ Identify the "Golden Buying Window"
- ✅ Avoid high-risk correction cycles
- ✅ Backtested data from the last 20+ years