
May 26, 2026 a 07:31 am

EFX: Dividend Analysis - Equifax Inc.
Equifax Inc., a financial data company, has a robust dividend profile with consistent payments and a history of 42 years. Despite a modest yield, the company showcases potential for steady income, reflected in its disciplined payout ratios and historical dividend growth.
📊 Overview
| Metric | Value |
|---|---|
| Sector | Information Technology |
| Dividend yield | 1.29% |
| Current dividend per share | $1.89 |
| Dividend history | 42 years |
| Last cut or suspension | None |
📈 Dividend History
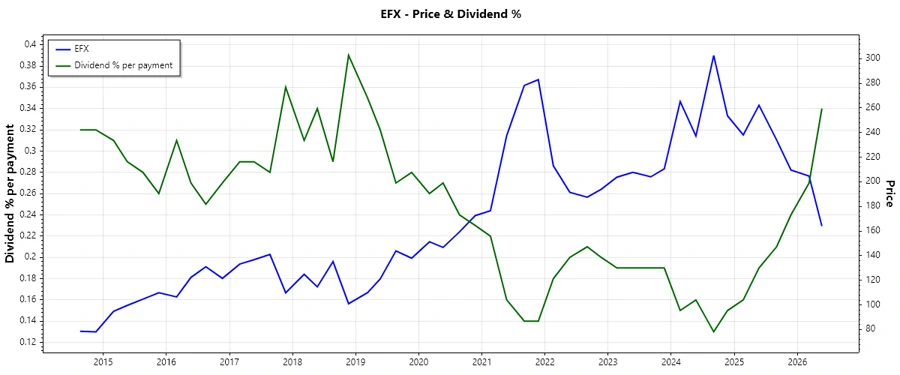
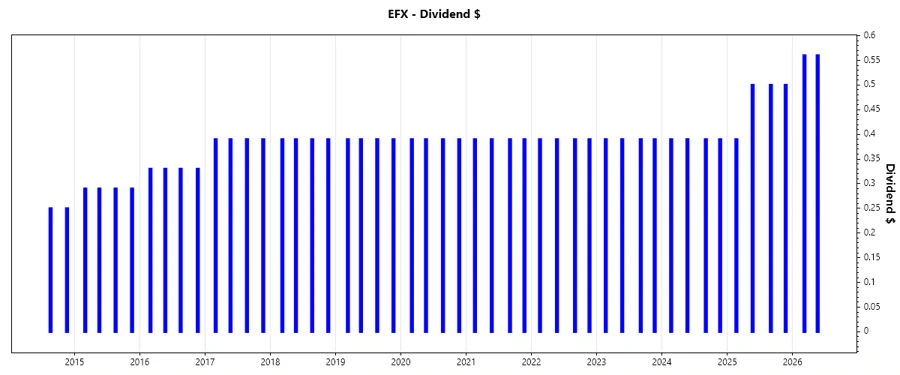
The dividend history of Equifax Inc. illustrates its commitment to shareholder returns, maintaining consistent payouts over decades without suspension. This resilience is crucial for long-term investors relying on stable dividends.
| Year | Dividend per Share (USD) |
|---|---|
| 2026 | 1.12 |
| 2025 | 1.89 |
| 2024 | 1.56 |
| 2023 | 1.56 |
| 2022 | 1.56 |
🗣️ Dividend Growth
Dividend growth is a vital indicator of a company's financial health and ability to increase returns to shareholders. Equifax Inc. displays gradual growth in dividends, reflecting its potential value appreciation over time.
| Time | Growth |
|---|---|
| 3 years | 6.61% |
| 5 years | 3.91% |
The average dividend growth is 3.91% over 5 years. This shows moderate but steady dividend growth.
✅ Payout Ratio
The payout ratio measures the proportion of earnings paid out as dividends, indicating the sustainability of dividend payments. A lower ratio may suggest a more sustainable dividend.
| Key figure | Ratio |
|---|---|
| EPS-based | 32.45% |
| Free cash flow-based | 20.01% |
With an EPS payout ratio of 32.45% and FCF payout ratio of 20.01%, Equifax Inc. demonstrates a conservative approach, indicating sustainable dividend payments.
📉 Cashflow & Capital Efficiency
Robust cash flows ensure the company can sustain dividend payments and invest in growth. Capital efficiency metrics provide insights into asset utilization.
| Metric | 2023 | 2024 | 2025 |
|---|---|---|---|
| Free Cash Flow Yield | 1.70% | 2.58% | 4.24% |
| Earnings Yield | 1.79% | 1.91% | 2.47% |
| CAPEX to Operating Cash Flow | 53.84% | 38.62% | 29.79% |
| Stock-based Compensation to Revenue | 1.36% | 1.44% | 1.29% |
| Free Cash Flow / Operating Cash Flow Ratio | 46.16% | 61.38% | 70.20% |
Equifax's capital efficiency indicates prudent use of cashflows, with a healthy balance between reinvestment and shareholder returns.
⚠️ Balance Sheet & Leverage Analysis
Assessing financial leverage and balance sheet strength is pivotal for understanding debt levels and financial flexibility.
| Metric | 2023 | 2024 | 2025 |
|---|---|---|---|
| Debt-to-Equity | 1.26 | 1.04 | 1.11 |
| Debt-to-Assets | 46.51% | 42.61% | 42.93% |
| Debt-to-Capital | 55.74% | 51.09% | 52.52% |
| Net Debt to EBITDA | 3.48 | 2.81 | 2.72 |
| Current Ratio | 0.67 | 0.75 | 0.60 |
| Quick Ratio | 0.67 | 0.75 | 0.60 |
| Financial Leverage | 2.71 | 2.45 | 2.58 |
Equifax's leverage ratios highlight manageable debt levels and decent liquidity, though continuous monitoring is suggested.
📑 Fundamental Strength & Profitability
Profitability metrics indicate how efficiently a company is converting revenues into profits, which affect its ability to maintain and grow dividends.
| Metric | 2023 | 2024 | 2025 |
|---|---|---|---|
| Return on Equity | 12.03% | 12.59% | 14.34% |
| Return on Assets | 4.44% | 5.14% | 5.57% |
| Margins: Net | 10.36% | 10.63% | 10.87% |
| Margins: EBIT | 18.22% | 18.30% | 18.23% |
| Margins: EBITDA | 29.99% | 30.27% | 30.07% |
| Margins: Gross | 55.65% | 55.67% | 44.60% |
| Research & Development to Revenue | 0% | 0% | 0% |
Equifax demonstrates strong profitability metrics with consistent margins and return ratios, signifying effective cost management and revenue generation.
📈 Price Development
🏆 Dividend Scoring System
| Category | Score | Visualization |
|---|---|---|
| Dividend yield | 3 | |
| Dividend Stability | 5 | |
| Dividend growth | 4 | |
| Payout ratio | 4 | |
| Financial stability | 4 | |
| Dividend continuity | 5 | |
| Cashflow Coverage | 3 | |
| Balance Sheet Quality | 3 |
Total score: 31/40
🗳️ Rating
Equifax Inc. scores a robust 31 out of 40 in our dividend scoring system, reflecting its commendable dividend history and fundamental strength. Investors seeking stable and moderately growing dividends will find Equifax an attractive choice, though debt levels require occasional review.
Smart Data Insight
Master the Perfect Entry & Exit for this Stock
Don't leave your profits to chance. Historically, this stock follows specific seasonal patterns that institutional traders use to maximize returns.
- ✅ Identify the "Golden Buying Window"
- ✅ Avoid high-risk correction cycles
- ✅ Backtested data from the last 20+ years