April 17, 2026 a 07:31 am


EFX: Dividend Analysis - Equifax Inc.
Equifax Inc. demonstrates a consistent dividend history with a 1.01% yield. Its dividends have been steadily growing over the years, showcasing financial stability. With long-term growth in dividends, it remains a moderate yet dependable choice for income-focused investors. The firm’s strong dividend coverage ratios reflect its capacity to sustain payouts while maintaining financial health.
📊 Overview
Equifax Inc., positioned within the Information Technology sector, offers a reliable dividend with a yield of 1.01% and a current dividend per share amounting to USD 1.89. The company has an impressive dividend history spanning 42 years without any recorded cuts or suspensions, reinforcing its commitment to shareholder returns.
| Parameter | Value |
|---|---|
| Sector | Information Technology |
| Dividend Yield | 1.01% |
| Current Dividend Per Share | 1.89 USD |
| Dividend History | 42 years |
| Last Cut or Suspension | None |
📈 Dividend History
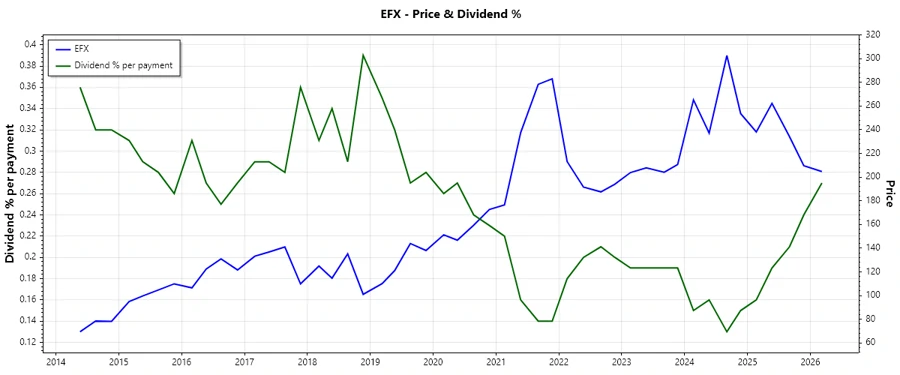
Equifax Inc.’s consistent dividend history is a testament to its financial stability and shareholder value commitment. Regular dividends with minimal suspensions indicate a robust business model. This historical performance is crucial for investors focusing on stable income.
| Year | Dividend Per Share (USD) |
|---|---|
| 2026 | 0.56 |
| 2025 | 1.89 |
| 2024 | 1.56 |
| 2023 | 1.56 |
| 2022 | 1.56 |
📉 Dividend Growth
Monitoring dividend growth rates is essential as they indicate a company's future payout capabilities and financial growth. Equifax Inc. has maintained moderate growth over corresponding periods, projecting steady annual excess returns.
| Time | Growth |
|---|---|
| 3 years | 6.61% |
| 5 years | 3.91% |
The average dividend growth is 3.91% over 5 years. This shows moderate but steady dividend growth.
✅ Payout Ratio
The payout ratio is an indicator of the dividend sustainability and potential future distribution increases. An EPS-based payout ratio of 34.74% and a FCF-based payout ratio of 20.10% reveal a manageable balance between cost-sharing and financial reinvestment opportunities.
| Key figure | Ratio |
|---|---|
| EPS-based | 34.74% |
| Free cash flow-based | 20.10% |
With the EPS payout ratio at 34.74% and the FCF payout ratio at 20.10%, Equifax Inc. is in a strong position to maintain and potentially increase its dividend payouts without straining financial resources.
🗣️ Cashflow & Capital Efficiency
Cash flow figures and capital efficiency metrics reveal significant details about operational health, offering insight into future financial moves. These values are crucial for understanding Equifax's ability to reinvest in business growth without sacrificing shareholder returns.
| Value | 2023 | 2024 | 2025 |
|---|---|---|---|
| Free Cash Flow Yield | 1.70% | 2.58% | 4.24% |
| Earnings Yield | 1.79% | 1.91% | 2.47% |
| CAPEX to Operating Cash Flow | 53.84% | 38.62% | 29.80% |
| Stock-based Compensation to Revenue | 1.36% | 1.44% | 1.29% |
| Free Cash Flow / Operating Cash Flow | 46.15% | 61.38% | 70.20% |
Evaluating these figures reflects Equifax's ability to manage its cash flow efficiently, optimizing both returns and investment capabilities. A strong cash flow position can promote growth without compromising dividends.
📈 Balance Sheet & Leverage Analysis
These key ratios offer insights into Equifax Inc.’s liquidity and gearing levels, crucial for financial health and meeting future obligations. Monitoring debt relations helps evaluate risk levels for long-term strategic planning.
| Value | 2023 | 2024 | 2025 |
|---|---|---|---|
| Debt-to-Equity | 1.26 | 1.04 | 1.11 |
| Debt-to-Assets | 46.51% | 42.61% | 42.93% |
| Debt-to-Capital | 55.74% | 51.09% | 52.52% |
| Net Debt to EBITDA | 3.48 | 2.81 | 2.69 |
| Current Ratio | 0.67 | 0.75 | 0.60 |
| Quick Ratio | 0.67 | 0.75 | 0.60 |
| Financial Leverage | 2.71 | 2.45 | 2.58 |
The balance sheet indicators suggest a balanced leverage, with ratios well within acceptable ranges to support future funding operations. Equifax's control of debt levels helps sustain its capacity to distribute dividends consistently.
📉 Fundamental Strength & Profitability
Assessing these fundamentals helps comprehensively understand a company's financial soundness. They provide essential insights into Equifax's operational effectiveness, guiding strategic financial decisions for profitability enhancement.
| Value | 2023 | 2024 | 2025 |
|---|---|---|---|
| Return on Equity | 12.03% | 12.59% | 14.34% |
| Return on Assets | 4.44% | 5.14% | 5.57% |
| Margins: Net | 10.36% | 10.63% | 10.87% |
| Margins: EBIT | 18.22% | 18.30% | 18.23% |
| Margins: EBITDA | 29.99% | 30.28% | 30.07% |
| Margins: Gross | 55.65% | 55.67% | 44.60% |
| Research & Development to Revenue | 0% | 0% | 0% |
Focused profitability metrics demonstrate Equifax Inc.'s ability to generate sufficient returns and maintain healthy margins, underpinning its capacity to sustain and grow dividends over time.
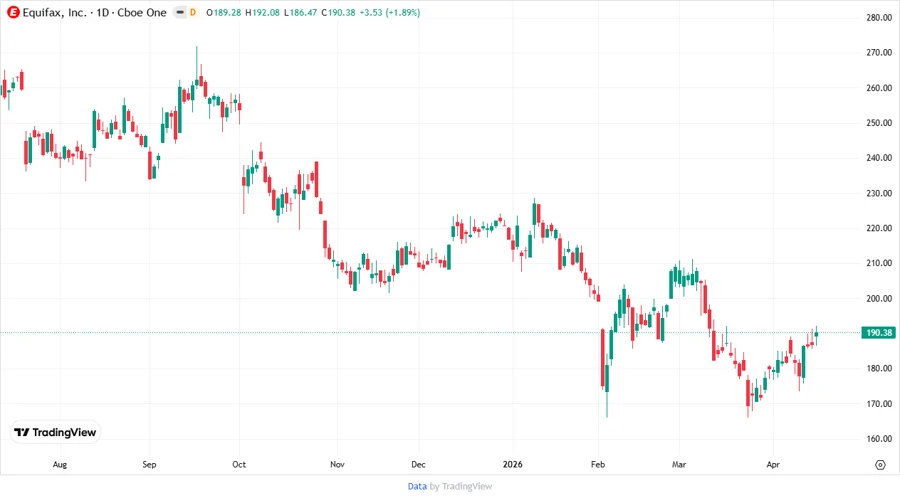
Price Development
Dividend Scoring System
| Criteria | Score | Graphical Representation |
|---|---|---|
| Dividend Yield | 3 | |
| Dividend Stability | 5 | |
| Dividend Growth | 3 | |
| Payout Ratio | 4 | |
| Financial Stability | 4 | |
| Dividend Continuity | 5 | |
| Cashflow Coverage | 4 | |
| Balance Sheet Quality | 4 |
Total Score: 32 / 40
Rating
Equifax Inc. presents a solid investment case for dividend-focused investors, with a consistent history and potential for moderate growth. The company maintains a balanced payout regime supportive of sustainable dividend payments.
Despite a modest yield, the strong financial backing and clear growth trajectory support a positive recommendation, ideal for those pursuing stable income generation.