February 18, 2026 a 07:47 am


EFX: Dividend Analysis - Equifax Inc.
Equifax, a prominent player in the financial sector, has maintained its position in the market through steady dividend payments and capital management. With a historical consistency in dividends spanning over four decades, Equifax showcases reliability in revenue distribution, albeit with a modest yield. While past suspensions in 2008 emphasize cautious optimism, the current metrics suggest a sustainable payout policy supported by robust financial ratios.
Overview 📊
The financial dynamics of Equifax Inc. reflect a stable dividend outlook with subtle growth potential. The company navigates within the financial sector, offering a conservative dividend yield coupled with a steady per-share distribution.
| Metric | Value |
|---|---|
| Sector | Financial |
| Dividend yield | 0.90 % |
| Current dividend per share | 1.89 USD |
| Dividend history | 41 years |
| Last cut or suspension | 2008 |
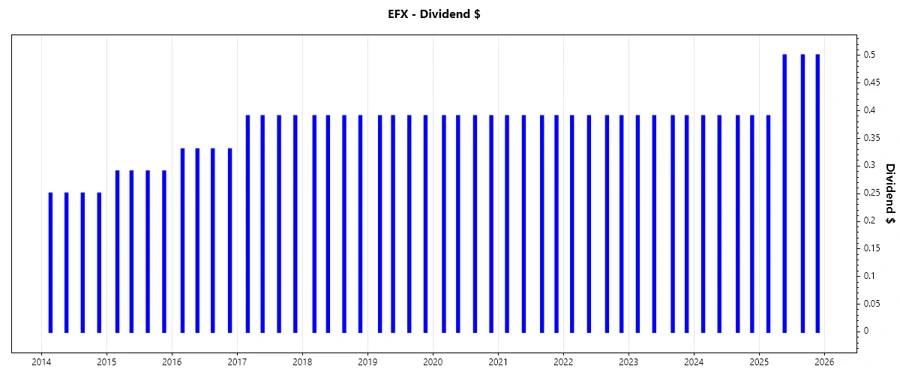
Dividend History 🗣️
Equifax's commitment to returning value to shareholders is evident from its consistent dividend distributions over the years. Understanding the historical dividend payments is crucial for assessing potential future performance and investor trust.
| Year | Dividend per Share (USD) |
|---|---|
| 2025 | 1.89 |
| 2024 | 1.56 |
| 2023 | 1.56 |
| 2022 | 1.56 |
| 2021 | 1.56 |
Dividend Growth 📈
Evaluating the growth trajectory of dividends provides insight into Equifax's ability to expand shareholder returns. The company's growth over both the three and five-year periods indicates a moderate yet promising increase in distributions.
| Time | Growth |
|---|---|
| 3 years | 6.61% |
| 5 years | 3.91% |
The average dividend growth is 3.91% over 5 years. This shows moderate but steady dividend growth.
Payout Ratio 📉
The payout ratio reflects the proportion of earnings a firm pays to shareholders in dividends. It's a key indicator of sustainability and capital allocation efficiency.
| Key figure | Ratio |
|---|---|
| EPS-based | 34.74% |
| Free cash flow-based | 20.39% |
The EPS-based payout ratio at 34.74% and a FCF-based payout ratio of 20.39% suggest a conservative allocation of earnings towards dividends, allowing for retained earnings to support business growth and stability.
Cashflow & Capital Efficiency
Cash flow metrics and capital efficiency ratios gauge a firm's ability to generate cash relative to capital investments, indicating the economic competence of Equifax. This evaluation assists in comprehending liquidity and overall financial health.
| Year | 2023 | 2024 | 2025 |
|---|---|---|---|
| Free Cash Flow Yield | 1.70% | 2.58% | 4.24% |
| Earnings Yield | 1.79% | 1.91% | 2.47% |
| CAPEX to Operating Cash Flow | 53.84% | 38.62% | 29.80% |
| Stock-based Compensation to Revenue | 1.37% | 1.44% | 1.29% |
| Free Cash Flow / Operating Cash Flow Ratio | 46.16% | 61.38% | 70.20% |
Equifax's cash flow efficiency, reflected through stable yields and optimized capital allocation, supports its dividend policy and financial reinforcement strategies.
Balance Sheet & Leverage Analysis
The balance sheet analysis scrutinizes Equifax's leverage and ensures long-term financial stability by examining debt management efficiency and liquidity-based metrics.
| Year | 2023 | 2024 | 2025 |
|---|---|---|---|
| Debt-to-Equity | 1.26 | 1.04 | 1.11 |
| Debt-to-Assets | 46.51% | 42.61% | 42.93% |
| Debt-to-Capital | 55.74% | 51.09% | 52.52% |
| Net Debt to EBITDA | 3.48 | 2.81 | 2.69 |
| Current Ratio | 0.67 | 0.75 | 0.60 |
| Quick Ratio | 0.67 | 0.75 | 0.60 |
| Financial Leverage | 2.71 | 2.45 | 2.58 |
Equifax's financial leverage ratios suggest a significant reliance on debt financing; however, controlled metrics assure financial integrity and potential balance sheet fortification.
Fundamental Strength & Profitability
Assessing profitability through fundamental strength ratios offers an understanding of operational efficiency and economic performance, vital for dividend sustainability and investor confidence.
| Year | 2023 | 2024 | 2025 |
|---|---|---|---|
| Return on Equity | 12.03% | 12.59% | 14.34% |
| Return on Assets | 4.44% | 5.14% | 5.57% |
| Margins: Net | 10.36% | 10.63% | 10.87% |
| EBIT | 18.22% | 18.30% | 18.23% |
| EBITDA | 30.07% | 30.28% | 30.07% |
| Gross | 55.65% | 55.67% | 44.60% |
| Research & Development to Revenue | 0% | 0% | 0% |
Strong profitability and growth ratios underscore Equifax's capacity to sustain dividends while achieving operational excellence, backed by substantial equity returns and maintained margins.
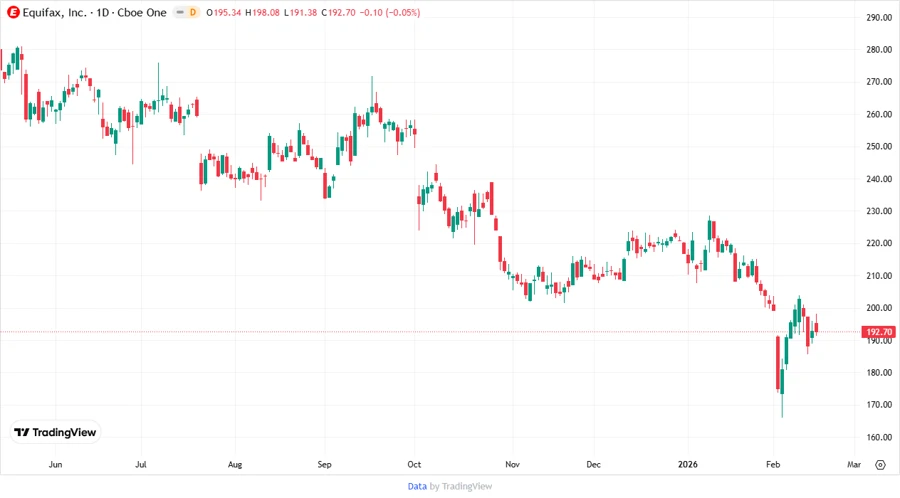
Price Development
Dividend Scoring System
| Category | Score | Score Bar |
|---|---|---|
| Dividend yield | 2 | |
| Dividend Stability | 4 | |
| Dividend growth | 3 | |
| Payout ratio | 4 | |
| Financial stability | 3 | |
| Dividend continuity | 5 | |
| Cashflow Coverage | 4 | |
| Balance Sheet Quality | 3 |
Total Score: 28/40
Rating
Equifax Inc. holds a compelling dividend proposition underlined by its moderate yield, robust payout stability, and growth potential. The financial metrics support a cautious yet positive outlook, making it an attractive hold for income-seeking investors in a balanced portfolio.