August 25, 2025 a 02:47 am

EFX: Dividend Analysis - Equifax Inc.
Equifax Inc., with a long history of stable dividend payments, has consistently maintained a moderate dividend yield. The company's disciplined payout ratios highlight financial prudence, assuring investors of sustainable dividend distributions. As a key player in its sector, Equifax's financial performance emphasizes a commitment to achieving shareholder value.
📊 Overview
Equifax Inc. operates within the financial sector, maintaining a solid dividend yield and a strong history of dividends over the past 41 years. The stability and growth of dividends reinforce investor confidence, with no recent cuts or suspensions reported.
| Metric | Value |
|---|---|
| Sector | Financial |
| Dividend Yield | 0.70% |
| Current Dividend per Share | 1.56 USD |
| Dividend History | 41 years |
| Last Cut or Suspension | None |
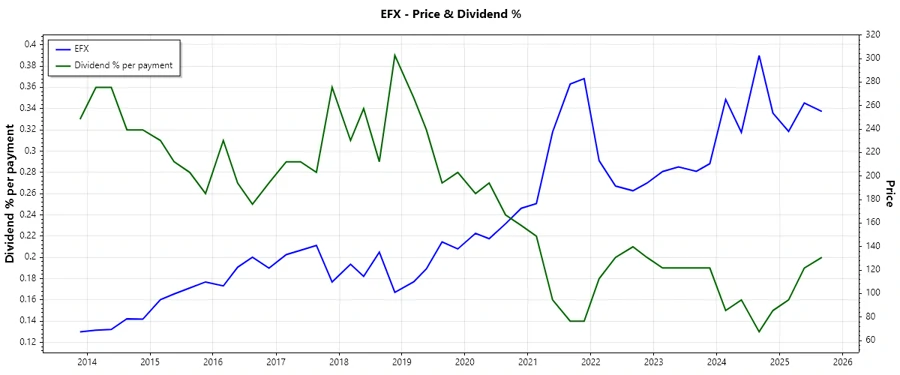
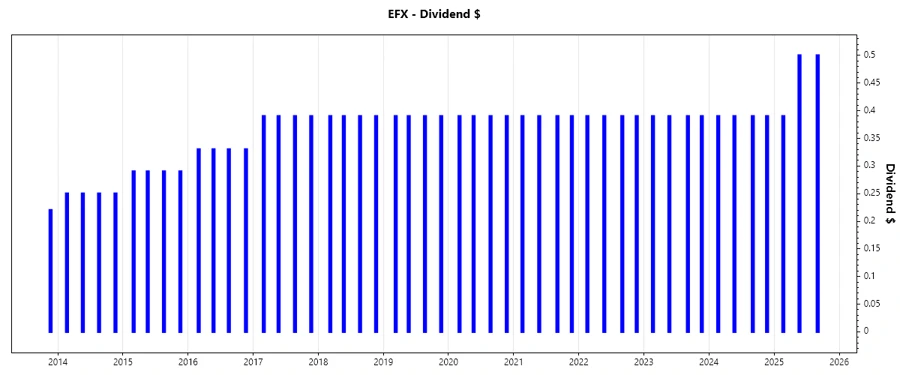
🗣️ Dividend History
The dividend history of Equifax Inc. showcases its robust financial health and commitment to returning value to shareholders. This long-term stability promotes investor trust, which is vital for strategic financial planning.
| Year | Dividend per Share |
|---|---|
| 2025 | 1.39 USD |
| 2024 | 1.56 USD |
| 2023 | 1.56 USD |
| 2022 | 1.56 USD |
| 2021 | 1.56 USD |
📈 Dividend Growth
Equifax Inc.'s recent dividend growth rate, though negligible in the latest three and five-year periods, reflects a stable approach to dividend distribution. This is vital for maintaining investor confidence, particularly in volatile market conditions.
| Time | Growth |
|---|---|
| 3 years | 0% |
| 5 years | 0% |
The average dividend growth is 0% over 5 years. This shows moderate but steady dividend growth.
✅ Payout Ratio
Payout ratios provide insight into how much of Equifax's earnings are returned to shareholders. They serve as indicators of financial prudence in maintaining sustainable payout levels.
| Key figure | Ratio |
|---|---|
| EPS-based Payout Ratio | 30.25% |
| Free Cash Flow-based Payout Ratio | 21.07% |
The EPS-based payout ratio of 30.25% and FCF-based payout ratio of 21.07% indicate a conservative approach, allowing for reinvestment in growth and maintaining reliability in dividend payments.
⚠️ Cashflow & Capital Efficiency
The evaluation of cash flow ratios is essential in assessing Equifax's ability to meet its dividend commitments. Cash flow and capital efficiency metrics reveal financial sustainability and allocate capital responsibly.
| Metric | 2024 | 2023 | 2022 |
|---|---|---|---|
| Free Cash Flow Yield | 2.58% | 1.70% | 0.56% |
| Earnings Yield | 1.91% | 1.69% | 2.93% |
| CAPEX to Operating Cash Flow | 38.62% | 53.84% | 82.49% |
| Stock-based Compensation to Revenue | 1.44% | 1.36% | 1.22% |
| Free Cash Flow / Operating Cash Flow | 61.38% | 46.16% | 17.51% |
The financial metrics illustrate a commendable cash flow management strategy, ensuring consistent dividend payments without compromising growth and reinvestment needs.
Balance Sheet & Leverage Analysis
The balance sheet ratios, including debt and leverage metrics, indicate Equifax's financial resilience. Understanding these components helps assess the company's capacity to manage debt and maintain liquidity.
| Metric | 2024 | 2023 | 2022 |
|---|---|---|---|
| Debt-to-Equity | 104.45% | 125.96% | 146.27% |
| Debt-to-Assets | 42.61% | 46.51% | 50.12% |
| Debt-to-Capital | 51.09% | 55.74% | 59.39% |
| Net Debt to EBITDA | 2.81 | 3.48 | 3.29 |
| Current Ratio | 0.75 | 0.67 | 0.68 |
| Quick Ratio | 0.75 | 0.67 | 0.61 |
| Financial Leverage | 2.45 | 2.71 | 2.92 |
Despite increasing leverage, Equifax maintains a healthy balance sheet, indicating its ability to manage debt sustainably and ensuring stability.
Fundamental Strength & Profitability
Analyzing profitability ratios provides insight into operational efficiency and the potential for sustained earnings. These metrics are critical for evaluating overall business performance.
| Metric | 2024 | 2023 | 2022 |
|---|---|---|---|
| Return on Equity | 12.59% | 12.03% | 17.60% |
| Return on Assets | 5.14% | 4.44% | 6.03% |
| Net Margin | 10.63% | 10.36% | 13.59% |
| EBIT Margin | 18.30% | 18.22% | 21.72% |
| EBITDA Margin | 30.28% | 29.99% | 32.66% |
| Gross Margin | 55.67% | 55.65% | 57.49% |
| R&D to Revenue | 0% | 0% | 0% |
With solid returns and profit margins, Equifax exhibits strong operational efficiency, underpinning its capacity to generate consistent earnings and maintain dividend payouts.
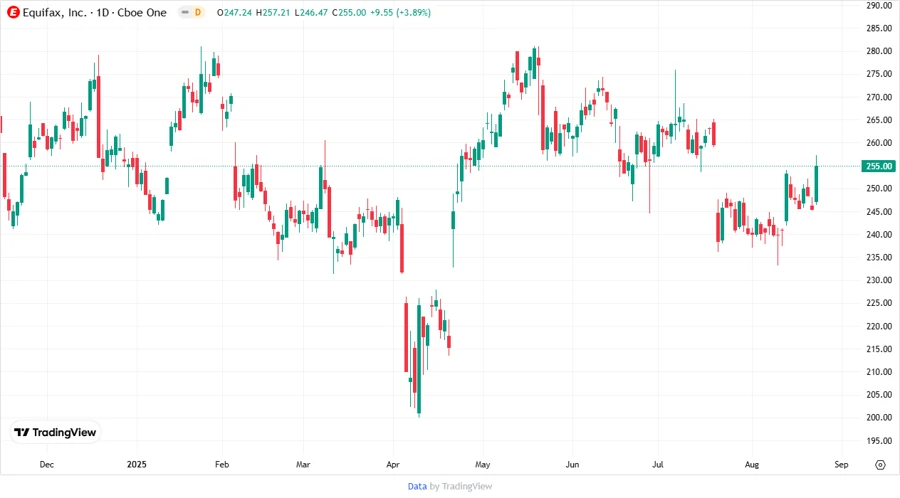
Price Development
Dividend Scoring System
Our Dividend Scoring System rates each category based on financial health and dividend performance. Key facets include yield, stability, growth, and financial metrics.
| Category | Score | Score Bar |
|---|---|---|
| Dividend Yield | 2 | |
| Dividend Stability | 5 | |
| Dividend Growth | 1 | |
| Payout Ratio | 4 | |
| Financial Stability | 4 | |
| Dividend Continuity | 5 | |
| Cashflow Coverage | 4 | |
| Balance Sheet Quality | 3 |
Total Score: 28/40
Rating
In summary, Equifax Inc. presents a balanced profile with strong dividend stability and prudent payout ratios, although limited growth potential. This positions the company as a reliable investment for income-focused investors seeking stability and moderate financial leverage.
Smart Data Insight
Master the Perfect Entry & Exit for this Stock
Don't leave your profits to chance. Historically, this stock follows specific seasonal patterns that institutional traders use to maximize returns.
- ✅ Identify the "Golden Buying Window"
- ✅ Avoid high-risk correction cycles
- ✅ Backtested data from the last 20+ years