May 12, 2026 a 11:44 am

ED: Fibonacci Analysis - Consolidated Edison, Inc.
Consolidated Edison, Inc. has shown a recent downtrend in its stock price over the past months. This decline reflects the broader market dynamics and sector-specific challenges faced by utility companies. The company's solid infrastructure and market presence in New York remain robust factors, yet investors should be cautious of regulatory impacts. As we analyze the recent trends, strategic entry points can be identified for potential rebounds.
Fibonacci Analysis
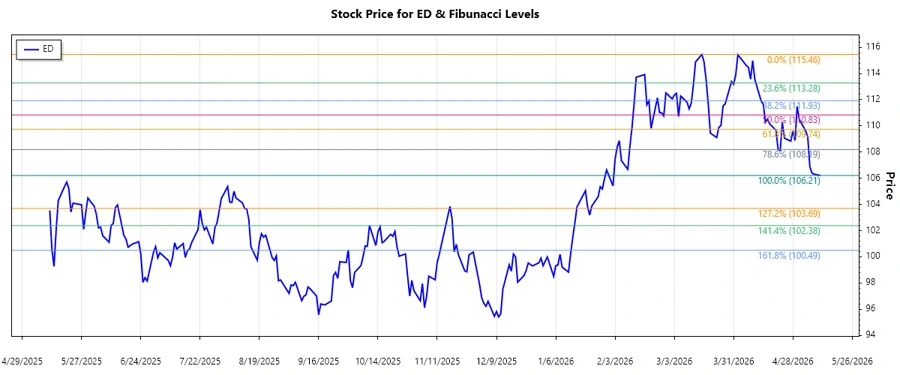
Based on the recent downtrend identified in Consolidated Edison, Inc.'s stock price, we have calculated the Fibonacci retracement levels. These levels are helpful in determining potential support and resistance areas as the stock attempts to rebound.
| Item | Date | Price |
|---|---|---|
| Start Date (High) | 2026-03-16 | 115.46 |
| End Date (Low) | 2026-05-11 | 106.21 |
| Fibonacci 0.236 | 108.44 | |
| Fibonacci 0.382 | 109.88 | |
| Fibonacci 0.5 | 110.83 | |
| Fibonacci 0.618 | 111.79 | |
| Fibonacci 0.786 | 113.14 |
The current price is within the 0.382 retracement zone, suggesting possible support in line with this level. This may indicate a potential rebound area if further positive market conditions support upward movement.
In this context, traders and investors may look for confirmation of price stability around these levels as potential support to consider entry points.
Conclusion
Consolidated Edison, Inc. currently faces a challenging outlook amid a recent downtrend. However, the established support in the identified retracement zones offers potential entry points for strategic investors. Balancing the risks of regulatory environments and market changes against the company's solid infrastructure can afford opportunities. Evaluating the stock's behavior around these Fibonacci levels may offer insights into its near-term trajectory and long-term value proposition.
Smart Data Insight
Master the Perfect Entry & Exit for this Stock
Don't leave your profits to chance. Historically, this stock follows specific seasonal patterns that institutional traders use to maximize returns.
- ✅ Identify the "Golden Buying Window"
- ✅ Avoid high-risk correction cycles
- ✅ Backtested data from the last 20+ years