
June 25, 2026 a 03:31 pm

ED: Dividend Analysis - Consolidated Edison, Inc.
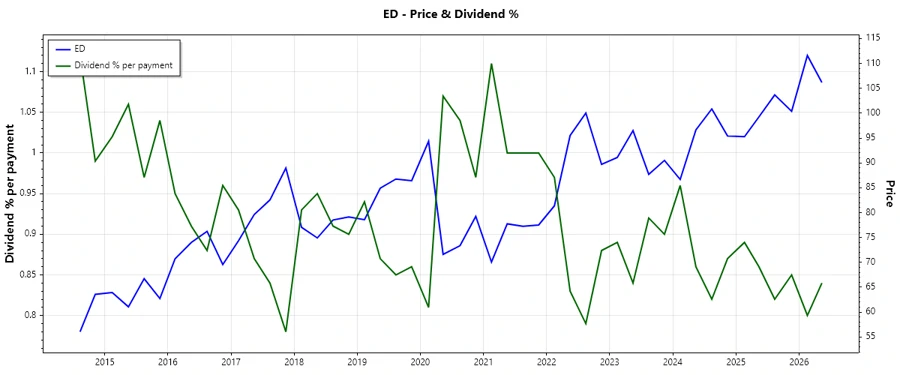
Consolidated Edison, Inc., a heavyweight in the utility sector, presents a stable dividend profile backed by its extensive history of uninterrupted payments for 57 years. With a current dividend yield of 3.27%, it stands as an attractive proposition for income-seeking investors. Despite moderate growth, the solid payout ratio affirms the company's capacity to sustain its dividend commitments.
📊 Overview
As a major player in the utility sector, Consolidated Edison demonstrates resilience through an impressive 57-year streak of dividends, providing a sense of security for investors. The dividend yield of 3.27% is comparable to industry standards, offering a balanced return.
| Key Data | Details |
|---|---|
| Sector | Utilities |
| Dividend Yield | 3.27% |
| Current Dividend per Share | $3.26 |
| Dividend History | 57 years |
| Last Cut or Suspension | None |
📈 Dividend History
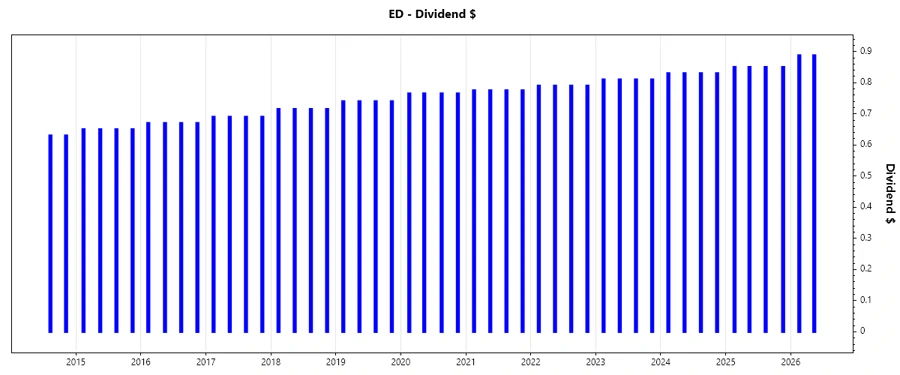
Understanding the dividend history is vital as it underscores the company’s commitment to shareholder returns. Consolidated Edison's dividends have shown remarkable consistency over decades.
| Year | Dividend per Share |
|---|---|
| 2026 | $1.775 |
| 2025 | $3.40 |
| 2024 | $3.32 |
| 2023 | $3.24 |
| 2022 | $3.16 |
✅ Dividend Growth
The dividend growth rate is a critical indicator of a company's future dividend-paying ability. Over the past 3 and 5 years, Consolidated Edison has shown a modest growth rate, indicating a steady, albeit slow, increment in dividends.
| Time | Growth |
|---|---|
| 3 years | 2.47% |
| 5 years | 2.13% |
The average dividend growth is 2.13% over 5 years. This shows moderate but steady dividend growth, ensuring gradual increases in shareholder returns.
🗣️ Payout Ratio
The payout ratio is a vital measure of dividend sustainability, assessing the proportion of earnings and cash flow distributed as dividends.
| Key Figure | Ratio |
|---|---|
| EPS-based | 54.95% |
| Free Cash Flow-based | 42.71% |
With a payout ratio of 54.95% (EPS) and 42.71% (FCF), Consolidated Edison effectively balances rewarding shareholders while retaining sufficient capital to fund its operations and future growth.
Cashflow & Capital Efficiency
Cash flow analysis highlights the financial health and operational efficiency, crucial for sustaining dividends and growth investments.
| Metric | 2025 | 2024 | 2023 |
|---|---|---|---|
| Free Cash Flow Yield | 0.10% | -3.75% | -7.39% |
| Earnings Yield | 5.70% | 5.90% | 7.96% |
| CAPEX to Operating Cash Flow | 99.25% | 132.01% | 208.44% |
| Stock-based Compensation to Revenue | 0% | 0% | 0% |
| Free Cash Flow / Operating Cash Flow Ratio | 0.75% | -32.01% | -108.44% |
The declining free cash flow yield poses challenges, yet a consistent earnings yield indicates the company’s underlying profitability. Balancing CAPEX with operational cash reflects prioritization of infrastructure and growth amid tight cash flows.
Balance Sheet & Leverage Analysis
A well-structured balance sheet is essential for long-term financial stability and successful leverage management.
| Metric | 2025 | 2024 | 2023 |
|---|---|---|---|
| Debt-to-Equity | 1.19 | 1.27 | 1.18 |
| Debt-to-Assets | 38.54% | 39.43% | 37.70% |
| Debt-to-Capital | 54.31% | 55.89% | 54.17% |
| Net Debt to EBITDA | 4.41 | 4.84 | 3.93 |
| Current Ratio | 1.02 | 1.04 | 1.01 |
| Quick Ratio | 0.94 | 0.96 | 0.94 |
| Financial Leverage | 3.08 | 3.21 | 3.13 |
Consolidated Edison's leverage ratios demonstrate effective debt usage, yet an elevated net debt to EBITDA ratio may require close monitoring to maintain financial flexibility.
Fundamental Strength & Profitability
Financially strong corporations maintain robust profitability ratios, ensuring sustainable growth and value generation.
| Metric | 2025 | 2024 | 2023 |
|---|---|---|---|
| Return on Equity | 8.36% | 8.29% | 11.91% |
| Return on Assets | 2.71% | 2.58% | 3.80% |
| Net Profit Margin | 11.96% | 11.93% | 17.20% |
| EBIT Margin | 22.64% | 21.79% | 27.52% |
| EBITDA Margin | 36.36% | 35.92% | 41.39% |
| Gross Margin | 62.02% | 63.99% | 61.17% |
Consistent ROE and strong margins reflect operational efficiency, reinforcing Consolidated Edison's capacity to deliver attractive returns despite volatile market conditions.
Price Development
Dividend Scoring System
| Category | Score | |
|---|---|---|
| Dividend Yield | 4 | |
| Dividend Stability | 5 | |
| Dividend Growth | 3 | |
| Payout Ratio | 4 | |
| Financial Stability | 4 | |
| Dividend Continuity | 5 | |
| Cashflow Coverage | 3 | |
| Balance Sheet Quality | 4 |
Overall Score: 32/40 points
Rating
Consolidated Edison, Inc. possesses a formidable dividend profile marked by consistency, reasonable yield, and sustainable payout ratios. Despite moderate growth, the company’s robust financial foundation and strategic capital allocation position it well for continued shareholder returns. Investors seeking steady income with growth potential may find Consolidated Edison an appealing choice.
Smart Data Insight
Master the Perfect Entry & Exit for this Stock
Don't leave your profits to chance. Historically, this stock follows specific seasonal patterns that institutional traders use to maximize returns.
- ✅ Identify the "Golden Buying Window"
- ✅ Avoid high-risk correction cycles
- ✅ Backtested data from the last 20+ years