March 04, 2026 a 11:31 am


ED: Dividend Analysis - Consolidated Edison, Inc.
Consolidated Edison, Inc. demonstrates a robust history of dividend payments, making it a reliable choice for income-focused investors. With a substantial market cap and a long-standing dividend history, the company showcases both stability and gradual growth in its dividend distributions. However, potential investors should assess the payout ratios and financial leverage to ensure the sustainability of the dividends amidst market fluctuations.
📊 Overview
Consolidated Edison, Inc. operates in the utility sector, a domain known for stable cash flows due to predictable demand. The company's current dividend yield stands at 3.08%, with a recent dividend per share set at 3.26 USD. It boasts a remarkable 57 years of consistent dividend history without recent cuts, highlighting its commitment to returning value to shareholders.
| Sector | Dividend Yield | Current Dividend Per Share (USD) | Dividend History (Years) | Last Cut or Suspension |
|---|---|---|---|---|
| Utilities | 3.08% | 3.26 | 57 | None |
📈 Dividend History
Understanding past dividend payments is crucial for predicting future stability and growth. A steady dividend history often signals robust financial management and sustainable earnings.
| Year | Dividend Per Share (USD) |
|---|---|
| 2026 | 0.88 |
| 2025 | 3.40 |
| 2024 | 3.32 |
| 2023 | 3.24 |
| 2022 | 3.16 |
📉 Dividend Growth
The company's dividend growth rates over three and five-year periods are vital indicators of long-term shareholder value appreciation. With moderate growth rates, investors can expect gradual appreciation in dividend income over time.
| Time | Growth |
|---|---|
| 3 years | 2.47% |
| 5 years | 2.13% |
The average dividend growth is 2.13% over 5 years. This shows moderate but steady dividend growth.
✅ Payout Ratio
The payout ratio is a critical indicator of dividend sustainability. A balanced ratio, particularly when comparing EPS and FCF metrics, helps assure investors of a company’s ability to maintain or grow dividends.
| Key Figure | Ratio |
|---|---|
| EPS-based | 58.25% |
| Free Cash Flow-based | 33.72% |
The EPS-based payout ratio of 58.25% and FCF-based ratio of 33.72% suggest a well-covered dividend, ensuring financial flexibility for further investments or dividend increases.
💰 Cashflow & Capital Efficiency
Evaluating cash flow generation and capital allocation helps determine a company’s operational efficiency and its capacity to sustain dividends.
| Year | Free Cash Flow Yield | Earnings Yield | CAPEX to Operating Cash Flow | Stock-based Compensation to Revenue | Free Cash Flow / Operating Cash Flow Ratio |
|---|---|---|---|---|---|
| 2025 | 0.10% | 5.70% | 99.25% | 0% | 0.75% |
| 2024 | -3.75% | 5.90% | 132.01% | 0% | -32.01% |
| 2023 | -7.39% | 7.96% | 208.44% | 0% | -108.44% |
The cash flow analysis indicates challenges in maintaining free cash flow, necessitating careful cost control and operational adjustments to preserve capital efficiency.
🏛️ Balance Sheet & Leverage Analysis
Balance sheet metrics provide insights into financial health and leverage, vital for understanding risk exposure and long-term solvency.
| Year | Debt-to-Equity | Debt-to-Assets | Debt-to-Capital | Net Debt to EBITDA | Current Ratio | Quick Ratio | Financial Leverage |
|---|---|---|---|---|---|---|---|
| 2025 | 1.19 | 38.54% | 54.31% | 4.41 | 0 | 0.94 | 3.08 |
| 2024 | 1.27 | 39.43% | 55.88% | 4.84 | 0 | 0.96 | 3.21 |
| 2023 | 1.18 | 37.70% | 54.17% | 3.93 | 0 | 0.94 | 3.14 |
Consolidated Edison's leverage and liquidity ratios underscore a solid premise for managing debt, though the relatively high debt-to-equity might necessitate further scrutiny for interest coverage.
💼 Fundamental Strength & Profitability
Profitability metrics, including returns and margins, are essential for gauging operational success and effective management practices.
| Year | Return on Equity | Return on Assets | Net Margin | EBIT Margin | EBITDA Margin | Gross Margin | R&D to Revenue |
|---|---|---|---|---|---|---|---|
| 2025 | 8.36% | 2.71% | 11.96% | 22.64% | 36.36% | 62.02% | 0% |
| 2024 | 8.29% | 2.58% | 11.93% | 21.79% | 35.92% | 63.99% | 0% |
| 2023 | 11.91% | 3.80% | 17.20% | 27.52% | 41.39% | 61.17% | 0% |
Effective asset utilization and profit margins highlight Consolidated Edison's capacity to maintain profitability, yet the absence of R&D investment may impact future growth potential.
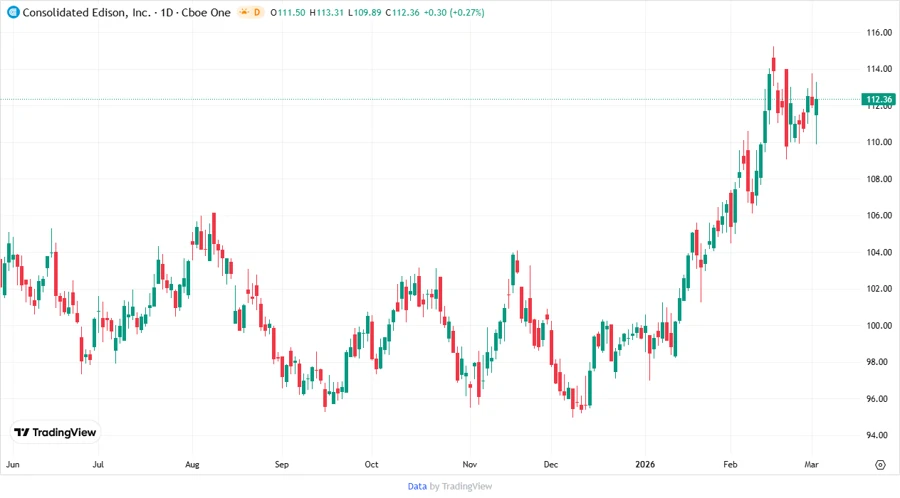
📊 Price Development
🔍 Dividend Scoring System
| Criteria | Score (1-5) | Rating Bar |
|---|---|---|
| Dividend yield | 4 | |
| Dividend Stability | 5 | |
| Dividend growth | 3 | |
| Payout ratio | 4 | |
| Financial stability | 4 | |
| Dividend continuity | 5 | |
| Cashflow Coverage | 3 | |
| Balance Sheet Quality | 4 |
Overall Score: 32/40
🗣️ Rating
Consolidated Edison, Inc. remains a solid investment for dividend-conscious investors due to its established dividend history and stable financial indicators. The company shows robust management practices with sound dividend practices, although careful observation of leverage and cash flows is recommended. It holds a moderate buy recommendation for those prioritizing income generation with a prudent eye on financial health.
Smart Data Insight
Master the Perfect Entry & Exit for this Stock
Don't leave your profits to chance. Historically, this stock follows specific seasonal patterns that institutional traders use to maximize returns.
- ✅ Identify the "Golden Buying Window"
- ✅ Avoid high-risk correction cycles
- ✅ Backtested data from the last 20+ years