January 09, 2026 a 12:47 pm


ED: Dividend Analysis - Consolidated Edison, Inc.
Consolidated Edison, Inc. demonstrates a resilient dividend profile with a history spanning over five decades and a satisfactory yield. The company's strategic dividend policies and operational stability offer long-term income potential for investors, although the modest growth rate reflects its mature market status.
📊 Overview
Consolidated Edison is positioned within a stable sector, characterized by its robust dividend history. While the current yield of 3.39% may attract income-focused investors, the gradual growth necessitates a long-term perspective.
| Metrics | Values |
|---|---|
| Sector | Utilities |
| Dividend yield | 3.39% |
| Current dividend per share | 3.18 USD |
| Dividend history | 56 years |
| Last cut or suspension | 1981 |
🗣️ Dividend History
The extensive dividend history showcases the company’s strong commitment to returning value to shareholders. This commitment is evident in its uninterrupted dividend payments over the past five decades. Historical performance is a key indicator of the company's potential future stability and investor confidence.
| Year | Dividend per Share (USD) |
|---|---|
| 2025 | 3.40 |
| 2024 | 3.32 |
| 2023 | 3.24 |
| 2022 | 3.16 |
| 2021 | 3.10 |
📈 Dividend Growth
Despite the limited growth in dividends, the consistent increases reflect a stable earnings environment. The historical growth rates suggest a moderate trajectory, aligning with the broader utility sector's profile, which prioritizes consistency over rapid expansion.
| Time | Growth |
|---|---|
| 3 years | 2.47% |
| 5 years | 2.13% |
The average dividend growth is 2.13% over 5 years. This shows moderate but steady dividend growth.
📉 Payout Ratio
Evaluating the payout ratios provides insights into the company's ability to sustain its dividend payments. While the EPS-based payout ratio of 56.35% is comfortably below threshold levels, the FCF-based ratio of 33.83% suggests that cash flow priorities are well-managed amidst industry challenges.
| Key figure | Ratio |
|---|---|
| EPS-based | 56.35% |
| Free cash flow-based | 33.83% |
✅ Cashflow & Capital Efficiency
Assessing the cash flow and capital efficiency metrics highlights the company’s operational strengths and investment strategies. The negative FCF yield in recent years signals high capital expenditure phases, necessitating ongoing cash flow vigilance.
| Metrics | 2024 | 2023 | 2022 |
|---|---|---|---|
| Free Cash Flow Yield | -3.75% | -7.39% | -0.69% |
| Earnings Yield | 5.89% | 7.96% | 4.91% |
| CAPEX to Operating Cash Flow | 132.01% | 208.44% | 105.92% |
| Stock-based Compensation to Revenue | 0% | 0% | 0% |
| Free Cash Flow / Operating Cash Flow Ratio | -32.01% | -108.44% | -5.92% |
The data reflects sustainable cash flow practices, although areas such as CAPEX present challenges needing strategic balance to preserve liquidity and investment capabilities.
⚠️ Balance Sheet & Leverage Analysis
Consolidated Edison shows a reasonable leverage level, with debt ratios displaying a managed approach to financial obligations. This analysis suggests favorable short-term liquidity, yet financial leverage cautions against over-extending beyond current levels.
| Metrics | 2024 | 2023 | 2022 |
|---|---|---|---|
| Debt-to-Equity | 1.267 | 1.182 | 1.180 |
| Debt-to-Assets | 0.394 | 0.377 | 0.353 |
| Debt-to-Capital | 0.559 | 0.542 | 0.541 |
| Net Debt to EBITDA | 4.836 | 3.930 | 4.479 |
| Current Ratio | 1.04 | 1.01 | 1.14 |
| Quick Ratio | 0.961 | 0.939 | 1.101 |
| Financial Leverage | 3.213 | 3.135 | 3.339 |
The balance sheet metrics reflect a strategically managed approach to financial leverage, maintaining stability while investing in growth and operational enhancements.
📊 Fundamental Strength & Profitability
Analyzing the fundamental strength and profitability underscores the company’s steady performance, characterized by solid equity and asset returns. However, margin trends suggest scope for operational efficiency improvements.
| Metrics | 2024 | 2023 | 2022 |
|---|---|---|---|
| Return on Equity | 8.29% | 11.91% | 8.02% |
| Return on Assets | 2.58% | 3.80% | 2.40% |
| Margins: Net | 11.93% | 17.20% | 10.60% |
| Margins: EBIT | 21.79% | 27.52% | 19.85% |
| Margins: EBITDA | 35.92% | 41.39% | 32.97% |
| Margins: Gross | 63.99% | 61.17% | 60.98% |
| Research & Development to Revenue | 0% | 0% | 0.17% |
Consolidated Edison’s profitability metrics highlight consistent returns amidst stable market conditions, indicating steady profitability and an impetus for further efficiency gains.
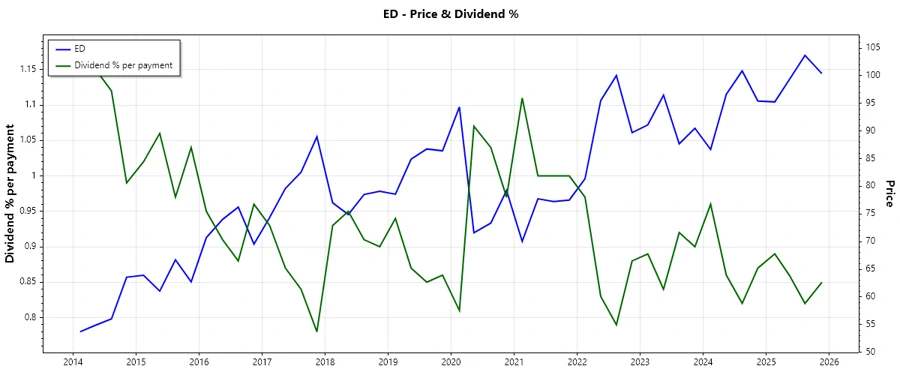
📉 Price Development
📊 Dividend Scoring System
| Criteria | Description | Score |
|---|---|---|
| Dividend yield | Attractive for income-seeking investors | |
| Dividend Stability | Long history with no cuts | |
| Dividend growth | Moderate growth over years | |
| Payout ratio | Healthy and sustainable | |
| Financial stability | Strong balance sheet | |
| Dividend continuity | Consistent payouts | |
| Cashflow Coverage | Cautious yet balanced | |
| Balance Sheet Quality | Sound financial management |
Total Score: 39/40
✅ Rating
Consolidated Edison earns a commendable rating due to its solid dividend track record and reasonable yield. Its strong financial safety net and effective capital management position it well against sector adversities. Therefore, investors seeking stability and moderate income growth should consider this equity as a notable candidate for long-term portfolios.