October 14, 2025 a 12:47 pm


ED: Dividend Analysis - Consolidated Edison, Inc.
Consolidated Edison, Inc. presents a robust dividend profile with a yield of approximately 3.26% and a sustained history of 56 years of dividend payments. The company’s payout strategy reflects reliability, albeit with a current challenge of a negative free cash flow yield. Stakeholders should note its commitment to returning value despite these cash flow constraints.
📊 Overview
Consolidated Edison, Inc. is entrenched in the utilities sector, distinguished by its consistent dividend policy sustained over 56 years. Its current dividend yield stands at 3.26%, with a dividend per share of $3.18. This stability is underlined by a seamless continuation without any recent cuts or suspensions.
| Metric | Detail |
|---|---|
| Sector | Utilities |
| Dividend yield | 3.26% |
| Current dividend per share | 3.18 USD |
| Dividend history | 56 years |
| Last cut or suspension | None |
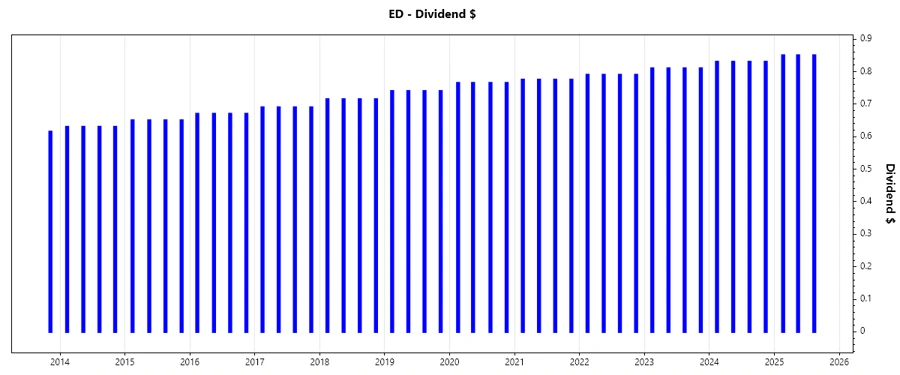
🗣️ Dividend History
The long-standing dividend history reflects the company’s sustained capacity to reward its shareholders. This track record enhances shareholder confidence and promotes stability in dividend expectations.
| Year | Dividend per Share (USD) |
|---|---|
| 2025 | 2.55 |
| 2024 | 3.32 |
| 2023 | 3.24 |
| 2022 | 3.16 |
| 2021 | 3.10 |
📈 Dividend Growth
Monitoring dividend growth provides insights into the company's potential for future increases in shareholder returns. A modest growth rate suggests a cautious yet steady approach.
| Time | Growth |
|---|---|
| 3 years | 2.31% |
| 5 years | 2.32% |
The average dividend growth is 2.32% over 5 years. This shows moderate but steady dividend growth.
✅ Payout Ratio
An analysis of payout ratios offers a view into the sustainability of dividend payments. Comparing EPS-based and FCF-based ratios demonstrates financial health and operational efficiency.
| Key figure | Ratio |
|---|---|
| EPS-based | 59.21% |
| Free cash flow-based | -412.44% |
The EPS-based payout ratio is reasonable, suggesting dividends are adequately covered by earnings. However, the negative FCF suggests liquidity concerns that must be addressed.
📉 Cashflow & Capital Efficiency
Examining cash flow and capital efficiency measures a company's ability to generate cash and utilize capital effectively to drive growth and return value to shareholders.
| Metric | 2024 | 2023 | 2022 |
|---|---|---|---|
| Free Cash Flow Yield | -3.75% | -7.39% | -0.68% |
| Earnings Yield | 5.90% | 7.96% | 4.91% |
| CAPEX to Operating Cash Flow | 132.01% | 208.44% | 105.92% |
| Stock-based Compensation to Revenue | 0.00% | 0.00% | 0.00% |
| Free Cash Flow / Operating Cash Flow Ratio | -32.01% | -108.44% | -5.92% |
The cash flow stability portrays a challenging environment but indicates the necessity for effective operational efficiencies and strategic CAPEX deployment to bolster financial resilience.
⚠️ Balance Sheet & Leverage Analysis
A balance sheet analysis provides an overview of the company's financial structure and leverage, highlighting its capacity to meet long-term obligations and manage debt levels.
| Metric | 2024 | 2023 | 2022 |
|---|---|---|---|
| Debt-to-Equity | 1.27 | 1.18 | 1.18 |
| Debt-to-Assets | 39.43% | 37.70% | 35.35% |
| Debt-to-Capital | 55.89% | 54.17% | 54.13% |
| Net Debt to EBITDA | 4.84 | 3.93 | 4.48 |
| Current Ratio | 1.04 | 1.01 | 1.14 |
| Quick Ratio | 0.96 | 0.94 | 1.10 |
| Financial Leverage | 3.21 | 3.14 | 3.34 |
The company's leverage ratios show a relatively high level of debt financing, which could pose risks if cash flows are not stabilised or if interest rates rise.
📈 Fundamental Strength & Profitability
Analyzing fundamental strength and profitability metrics provides a gauge on operational effectiveness and the capacity to generate profits from business activities.
| Metric | 2024 | 2023 | 2022 |
|---|---|---|---|
| Return on Equity | 8.29% | 11.91% | 8.02% |
| Return on Assets | 2.58% | 3.80% | 2.40% |
| Net Margin | 11.93% | 17.20% | 10.60% |
| EBIT Margin | 21.79% | 27.52% | 19.85% |
| EBITDA Margin | 35.92% | 41.39% | 32.97% |
| Gross Margin | 63.99% | 61.17% | 60.98% |
| R&D to Revenue | 0.00% | 0.00% | 0.17% |
The profitability metrics indicate fluctuations, with ROE and margins improving in 2023 but regressing slightly in 2024, suggesting potential for profitability enhancement under optimized operations.
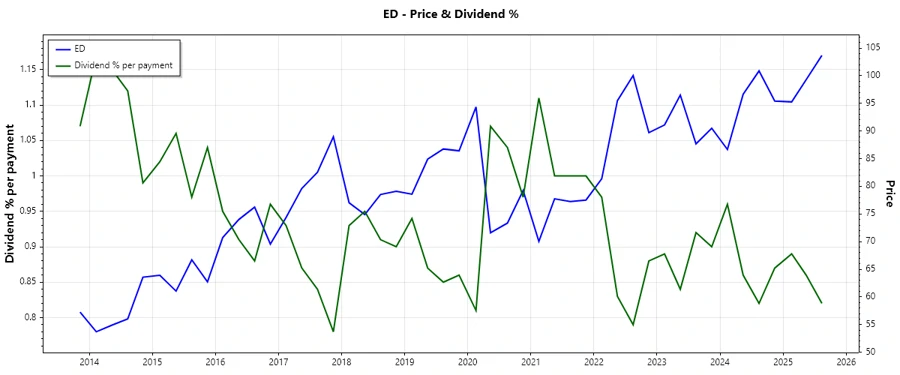
📉 Price Development
🌟 Dividend Scoring System
| Category | Score | Score Bar |
|---|---|---|
| Dividend yield | 4 | |
| Dividend Stability | 5 | |
| Dividend growth | 3 | |
| Payout ratio | 3 | |
| Financial stability | 3 | |
| Dividend continuity | 5 | |
| Cashflow Coverage | 2 | |
| Balance Sheet Quality | 3 |
Total Score: 28/40
🏆 Rating
Consolidated Edison, Inc. presents a stable dividend option with steady yields and a reliable historical record, although current free cash flow challenges and rising debt levels necessitate careful monitoring. The company remains a favorable candidate for long-term income-focused investors, provided strategic adjustments are made to enhance cash inflows and manage leverage effectively.
Smart Data Insight
Master the Perfect Entry & Exit for this Stock
Don't leave your profits to chance. Historically, this stock follows specific seasonal patterns that institutional traders use to maximize returns.
- ✅ Identify the "Golden Buying Window"
- ✅ Avoid high-risk correction cycles
- ✅ Backtested data from the last 20+ years