November 17, 2025 a 04:03 am
ECL: Trend and Support & Resistance Analysis - Ecolab Inc.
Ecolab Inc. has recently shown signs of volatility within its stock price, drawing significant attention from investors and analysts. As a key player in water, hygiene, and infection prevention solutions, the company operates through various business segments globally. The recent stock movements indicate a potential trend shift, thus necessitating a close review of support and resistance levels. Investors should carefully consider both the technical analysis and the company's market context before making investment decisions.
Trend Analysis
| Date | Closing Price | Trend |
|---|---|---|
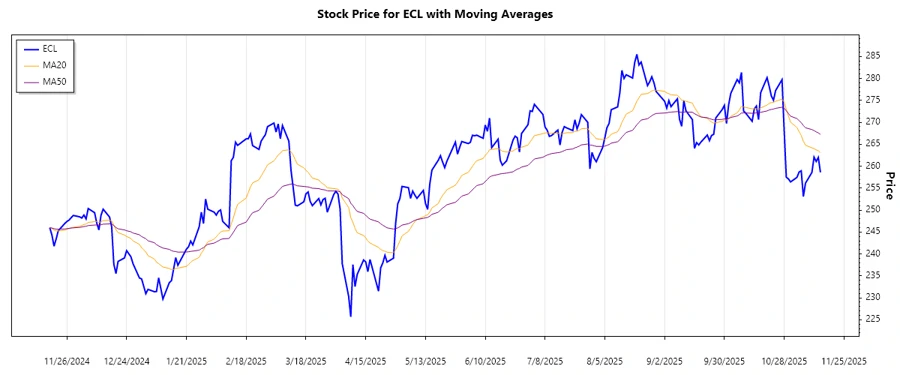
| 2025-11-14 | $258.58 | ▼ |
| 2025-11-13 | $261.98 | ▼ |
| 2025-11-12 | $261.06 | ▼ |
| 2025-11-11 | $262.05 | ▼ |
| 2025-11-10 | $258.56 | ▲ |
| 2025-11-07 | $256.13 | ▼ |
| 2025-11-06 | $253.06 | ▼ |
The EMA calculations indicate a dominant downward trend with the EMA20 below the EMA50. This suggests a bearish sentiment in the short term, marked by a sequence of lower highs and lower lows.
Support and Resistance
| Support Zone | Resistance Zone |
|---|---|
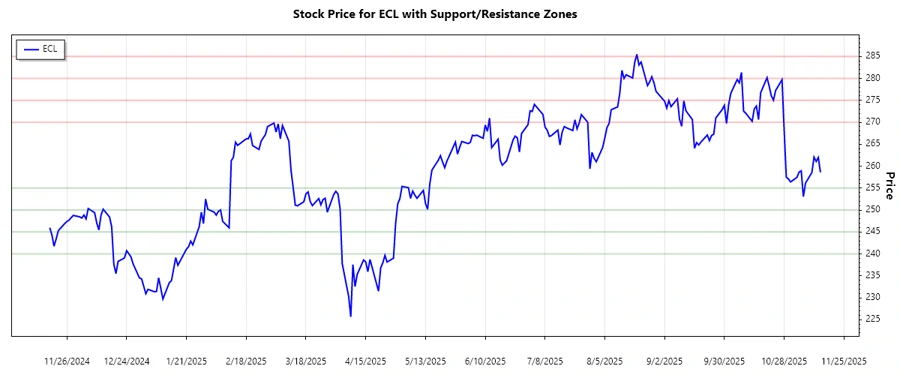
| $250.00 - $255.00 ➡️ | $270.00 - $275.00 ➡️ |
| $240.00 - $245.00 ➡️ | $280.00 - $285.00 ➡️ |
Currently, the stock price is hovering near the upper boundary of the first support zone. If the price can sustain above this level, it might prepare for a reversal or consolidation phase. If not, it risks dropping to the lower support zone.
Conclusion
The current analysis points towards a bearish trend for Ecolab Inc., with critical support zones being tested. A breach below these supports could lead to further declines. However, the fundamental prospect of Ecolab remains strong due to its diversified portfolio and global reach. Investors are advised to lookout for signs of reversal at current support zones, but remain cautious as the trend exhibits overall weakness. Balancing technical observations with macroeconomic factors will be essential for trading decisions moving forward.
Smart Data Insight
Master the Perfect Entry & Exit for this Stock
Don't leave your profits to chance. Historically, this stock follows specific seasonal patterns that institutional traders use to maximize returns.
- ✅ Identify the "Golden Buying Window"
- ✅ Avoid high-risk correction cycles
- ✅ Backtested data from the last 20+ years