March 03, 2026 a 03:15 pm## ECL: Fibonacci Analysis - Ecolab Inc.
 ## Fibonacci Analysis
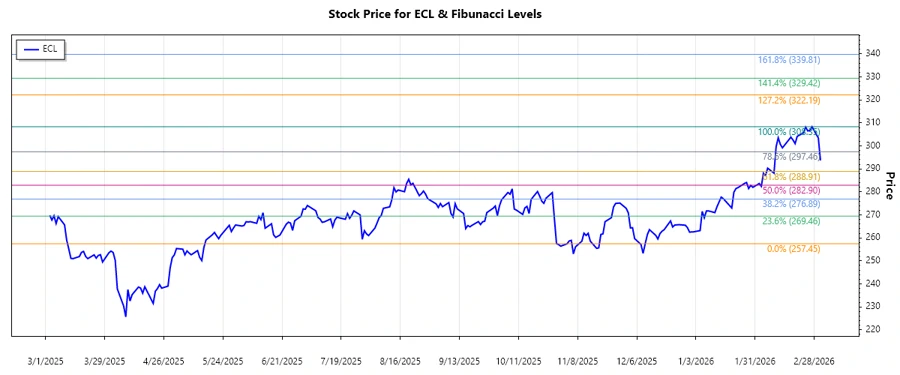
The recent price movements of Ecolab Inc. (ECL) suggest a robust uptrend in the analyzed period from December 2025 to March 2026. Utilizing Fibonacci retracement levels, we can identify potential support and resistance levels based on this trend.
## Fibonacci Analysis
The recent price movements of Ecolab Inc. (ECL) suggest a robust uptrend in the analyzed period from December 2025 to March 2026. Utilizing Fibonacci retracement levels, we can identify potential support and resistance levels based on this trend.
Fibonacci Retracement Levels:
- 0.236: 293.36
- 0.382: 283.06
- 0.5: 277.90
- 0.618: 272.74
- 0.786: 263.96
The current price of ECL resides within the 0.236 retracement level, indicating potential minor resistance at this level. If the price sustains above this level, it could signal continued support.
 ## Conclusion
Ecolab Inc. remains a strong contender in its industry, consistently enhancing its stock value through strategic operations. As the current price situates itself near a mild resistance level, an upward breach may imply further bullish momentum. Investors should monitor ECL's performance and market trends, as external factors could influence its trajectory. Balanced analysis is essential to identify the fine line between opportunities and potential retracements in Ecolab's price movement.
## Conclusion
Ecolab Inc. remains a strong contender in its industry, consistently enhancing its stock value through strategic operations. As the current price situates itself near a mild resistance level, an upward breach may imply further bullish momentum. Investors should monitor ECL's performance and market trends, as external factors could influence its trajectory. Balanced analysis is essential to identify the fine line between opportunities and potential retracements in Ecolab's price movement.
Ecolab Inc. has recently demonstrated a notable price trend, indicating strategic growth in its stock value. With its diverse business segments in water, hygiene, and infection prevention, Ecolab shows potential for continued expansion. Investors should analyze the recent uptrend for opportunities while considering market conditions that could affect future performance.
| Detail | Value |
|---|---|
| Trend Start Date | 2025-12-10 |
| Trend End Date | 2026-03-03 |
| High Point | 308.35 (2026-02-27) |
| Low Point | 257.45 (2025-12-10) |
## Conclusion
Ecolab Inc. remains a strong contender in its industry, consistently enhancing its stock value through strategic operations. As the current price situates itself near a mild resistance level, an upward breach may imply further bullish momentum. Investors should monitor ECL's performance and market trends, as external factors could influence its trajectory. Balanced analysis is essential to identify the fine line between opportunities and potential retracements in Ecolab's price movement.