
June 25, 2026 a 12:46 pm
ECL: Dividend Analysis - Ecolab Inc
Ecolab Inc represents a compelling prospect for long-term dividend investors. With a robust history of consistent dividend payments and growth over 42 years, the company demonstrates its commitment to returning value to shareholders. Its modest yield is complemented by reliable dividend growth, providing potential for both income and capital appreciation. However, examining the payout ratios and financial stability is crucial to understand the sustainability of its dividend policy in varying market conditions.
📊 Overview
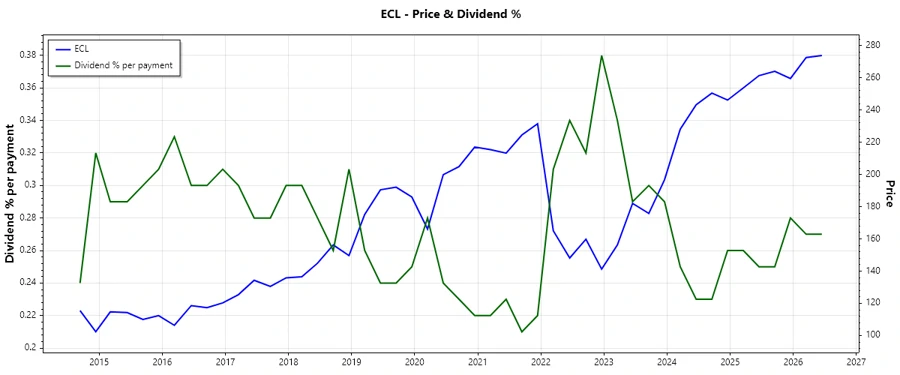
Ecolab Inc operates within the Chemical Manufacturing sector, characterized by moderate yields but consistent growth prospects. It offers a current dividend yield of 1.04% with a current dividend per share standing at 2.66 USD. Notably, Ecolab boasts a dividend history of 42 years without any recent cuts or suspensions, underscoring the company's reliable dividend distribution policy.
| Factor | Details |
|---|---|
| Sector | Chemical Manufacturing |
| Dividend yield | 1.04% |
| Current dividend per share | 2.66 USD |
| Dividend history | 42 years |
| Last cut or suspension | None |
📈 Dividend History
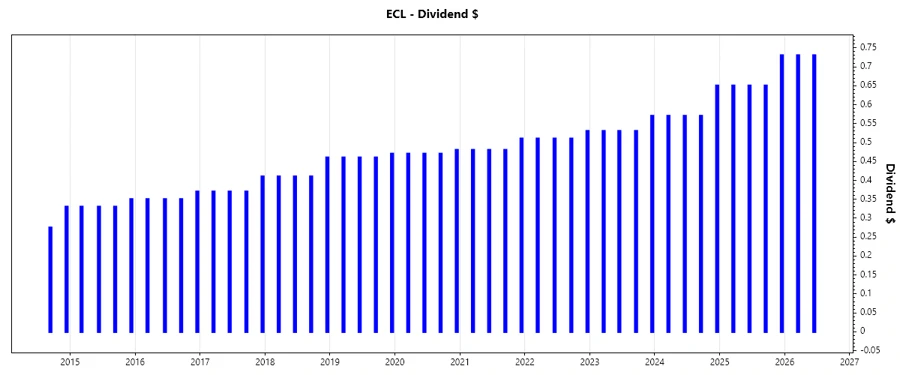
The rich dividend history of Ecolab is a testament to its management's competence and financial resilience. Maintaining a consistent payout over decades creates a reliable income stream and signals financial health to investors. A strong historical dividend pattern fosters investor confidence and sets expectations for future growth.
| Year | Dividend per Share (USD) |
|---|---|
| 2026 | 1.46 |
| 2025 | 2.68 |
| 2024 | 2.36 |
| 2023 | 2.16 |
| 2022 | 2.06 |
📉 Dividend Growth
Examining dividend growth is vital to ascertain the potential for increasing shareholder returns. Growth percentages give insight into a company's future payout trajectory and financial health. Ecolab's dividend growth over the last three years demonstrates a 9.17% increase, while the five-year growth shows a more moderate rise of 7.23%.
| Time | Growth |
|---|---|
| 3 years | 9.17% |
| 5 years | 7.23% |
The average dividend growth is 7.23% over five years, indicating moderate but steady dividend growth, appealing to investors seeking a blend of income and growth.
⚠️ Payout Ratio
Payout ratios are crucial indicators of dividend sustainability, illustrating the proportion of earnings distributed as dividends. Understanding these metrics helps in evaluating the company's ability to maintain such payouts amidst varying earnings and cash flow conditions.
| Key Figure | Ratio |
|---|---|
| EPS-based | 35.62% |
| Free cash flow-based | 40.03% |
The EPS payout ratio at 35.62% and FCF payout ratio at 40.03% suggest that Ecolab is efficiently utilizing its earnings to reward shareholders while retaining capital for potential growth and operational needs.
✅ Cashflow & Capital Efficiency
Cashflow metrics are essential for assessing financial resilience and growth potential. By observing capital efficiency ratios, investors can gauge Ecolab's ability to generate and allocate cash effectively for reinvestment and shareholder returns.
| Metric | 2023 | 2024 | 2025 |
|---|---|---|---|
| Free Cash Flow Yield | 2.90% | 2.73% | 2.56% |
| Earnings Yield | 2.43% | 3.17% | 2.79% |
| CAPEX to Operating Cash Flow | 32.13% | 35.34% | 35.50% |
| Stock-based Compensation to Revenue | 0.62% | 0.86% | 0.85% |
| Free Cash Flow / Operating Cash Flow Ratio | 67.87% | 64.66% | 64.50% |
Ecolab's cash flow metrics indicate a stable financial foundation supported by efficient capital allocation. The Free Cash Flow Yield demonstrates the firm's ability to generate cash relative to its enterprise value, enhancing financial flexibility.
🗣️ Balance Sheet & Leverage Analysis
Analyzing the balance sheet emphasizes a company's capacity to manage debt, and leverage ratios offer insights into financial stability. A sound balance sheet indicates strong liquidity and reduces the risk of financial distress.
| Metric | 2023 | 2024 | 2025 |
|---|---|---|---|
| Debt-to-Equity | 1.086 | 0.946 | 0.965 |
| Debt-to-Assets | 0.400 | 0.370 | 0.382 |
| Debt-to-Capital | 0.521 | 0.486 | 0.491 |
| Net Debt to EBITDA | 2.58 | 1.83 | 2.54 |
| Current Ratio | 1.30 | 1.26 | 1.08 |
| Quick Ratio | 0.95 | 0.95 | 0.81 |
| Financial Leverage | 2.72 | 2.56 | 2.53 |
The leverage ratios reveal Ecolab's relatively stable use of debt within its capital structure. With its manageable Net Debt to EBITDA ratio, Ecolab demonstrates significant capacity to service its obligations, promoting investor confidence.
📈 Fundamental Strength & Profitability
Evaluating fundamental strength involves examining profitability and operational efficiency metrics. Key profitability ratios like ROE and ROA offer insights into how effectively Ecolab utilizes equity and asset bases to generate profits.
| Metric | 2023 | 2024 | 2025 |
|---|---|---|---|
| Return on Equity | 17.06% | 24.12% | 21.24% |
| Return on Assets | 6.28% | 9.44% | 8.40% |
| Net Margin | 8.96% | 13.42% | 12.91% |
| EBIT Margin | 13.77% | 18.48% | 17.34% |
| EBITDA Margin | 19.80% | 24.43% | 21.53% |
| Gross Margin | 40.32% | 43.47% | 44.51% |
| R&D to Revenue | 1.25% | 1.32% | 0.00% |
Ecolab's profitability ratios highlight robust operational efficiency and competitive advantages in its sector. High ROE suggests effective management, utilizing investor capital to generate substantial returns, though it merits close monitoring in conjunction with decade-high growth rates.
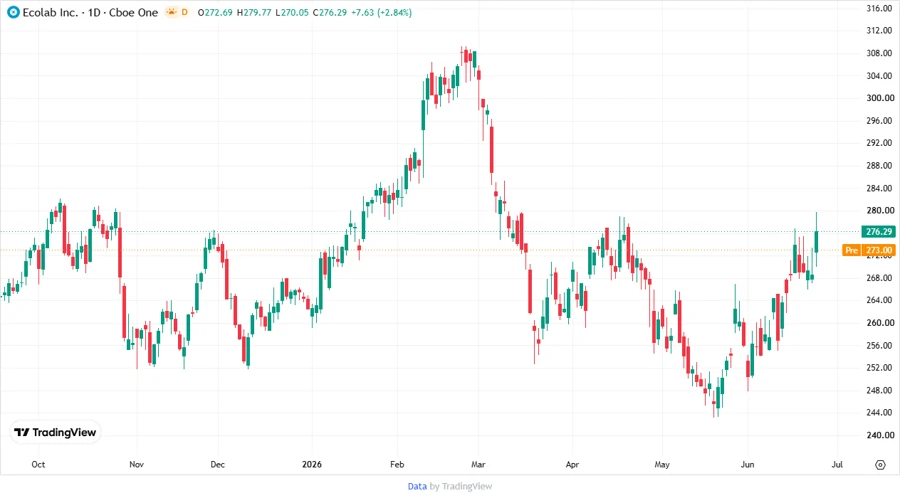
📉 Price Development
🗣️ Dividend Scoring System
| Criteria | Points | Score |
|---|---|---|
| Dividend yield | 3 | |
| Dividend Stability | 5 | |
| Dividend Growth | 4 | |
| Payout Ratio | 4 | |
| Financial Stability | 4 | |
| Dividend Continuity | 5 | |
| Cashflow Coverage | 4 | |
| Balance Sheet Quality | 4 |
Overall Score: 33 / 40
✅ Rating
Based on a comprehensive analysis, Ecolab Inc receives a robust recommendation as a reliable dividend-paying stock characterized by moderate growth potential and solid financial metrics. For investors seeking long-term stability with potential income appreciation, Ecolab presents an attractive opportunity. However, continued monitoring of market conditions and the company's financial health remains crucial.
Smart Data Insight
Master the Perfect Entry & Exit for this Stock
Don't leave your profits to chance. Historically, this stock follows specific seasonal patterns that institutional traders use to maximize returns.
- ✅ Identify the "Golden Buying Window"
- ✅ Avoid high-risk correction cycles
- ✅ Backtested data from the last 20+ years