February 01, 2026 a 07:46 am


ECL: Dividend Analysis - Ecolab Inc.
Ecolab Inc. presents a compelling dividend profile rooted in consistent growth and stability. With over four decades of uninterrupted dividend increases, the company exhibits a strong commitment to shareholder returns. The company's prudent capital management strategies have ensured sustainability even during economic fluctuations, while its payout ratios suggest a balanced approach to rewarding investors and maintaining growth opportunities.
Overview 📊
Ecolab Inc., a leader in its sector, offers solid dividend yields and a history of stability. The company’s dividend profile is marked by consistency and resilience.
| Detail | Value |
|---|---|
| Sector | Specialty Chemicals |
| Dividend yield | 1.03 % |
| Current dividend per share | $2.34 |
| Dividend history | 41 years |
| Last cut or suspension | 1987 |
Dividend History 🗣️
With dividends continually increasing for 41 years, Ecolab demonstrates reliability. Such consistency is crucial for attracting dividend-focused investors seeking steady income streams.
| Year | Dividend Per Share (USD) |
|---|---|
| 2025 | $2.68 |
| 2024 | $2.36 |
| 2023 | $2.16 |
| 2022 | $2.06 |
| 2021 | $1.95 |
Dividend Growth 📈
Ecolab's moderate dividend growth over three and five years highlights its ability to increase shareholder value over time.
| Time | Growth |
|---|---|
| 3 years | 9.17 % |
| 5 years | 7.23 % |
The average dividend growth is 7.23 % over 5 years. This shows moderate but steady dividend growth.
Payout Ratio ⚠️
Payout ratios provide insights into the sustainability of dividend payments. Ecolab maintains a prudent payout ratio, balancing between rewarding shareholders and investing in growth.
| Key figure | Ratio |
|---|---|
| EPS-based | 33.38 % |
| Free cash flow-based | 42.67 % |
Ecolab’s payout ratio of 33.38% (EPS) and 42.67% (FCF) indicate significant room for reinvestment and a commitment to dividend stability.
Cashflow & Capital Efficiency 📊
Capital efficiency and cash flow insights reflect Ecolab's operational stability and potential for sustained dividend payments.
| Metric | 2024 | 2023 | 2022 |
|---|---|---|---|
| Free Cash Flow Yield | 2.73 % | 2.90 % | 2.59 % |
| Earnings Yield | 3.17 % | 2.43 % | 2.63 % |
| CAPEX to Operating Cash Flow | 35.34 % | 32.13 % | 39.86 % |
| Stock-based Compensation to Revenue | 0.86 % | 0.62 % | 0.62 % |
| Free Cash Flow / Operating Cash Flow Ratio | 64.66 % | 67.87 % | 60.14 % |
The data confirm Ecolab's sound cash flow management and capital allocation, underpinning its ability to sustain and grow dividends.
Balance Sheet & Leverage Analysis 📉
A strong balance sheet underpins Ecolab’s operational stability and creditworthiness, which is essential for sustained dividend payouts.
| Ratio | 2024 | 2023 | 2022 |
|---|---|---|---|
| Debt-to-Equity | 0.95 | 1.09 | 1.25 |
| Debt-to-Assets | 0.37 | 0.40 | 0.42 |
| Debt-to-Capital | 0.49 | 0.52 | 0.56 |
| Net Debt to EBITDA | 1.83 | 2.58 | 3.31 |
| Current Ratio | 1.70 | 1.70 | 1.30 |
| Quick Ratio | 0.95 | 0.95 | 0.88 |
| Financial Leverage | 2.56 | 2.71 | 2.97 |
These metrics illustrate Ecolab's solid leverage position and liquidity, enhancing its long-term financial resilience.
Fundamental Strength & Profitability
Fundamental analysis confirms Ecolab's robust profitability and asset management capabilities, critical for ongoing dividend distributions.
| Metric | 2024 | 2023 | 2022 |
|---|---|---|---|
| Return on Equity | 24.12 % | 17.06 % | 15.09 % |
| Return on Assets | 9.44 % | 6.28 % | 5.09 % |
| Margins: Net | 13.42 % | 8.96 % | 7.69 % |
| EBIT | 18.48 % | 13.77 % | 11.33 % |
| EBITDA | 24.43 % | 19.80 % | 17.94 % |
| Gross | 43.47 % | 40.32 % | 38.20 % |
| Research & Development to Revenue | 1.32 % | 1.25 % | 1.34 % |
Ecolab's strong financial metrics signal a commitment to innovation and value creation, securing consistent returns for stakeholders.
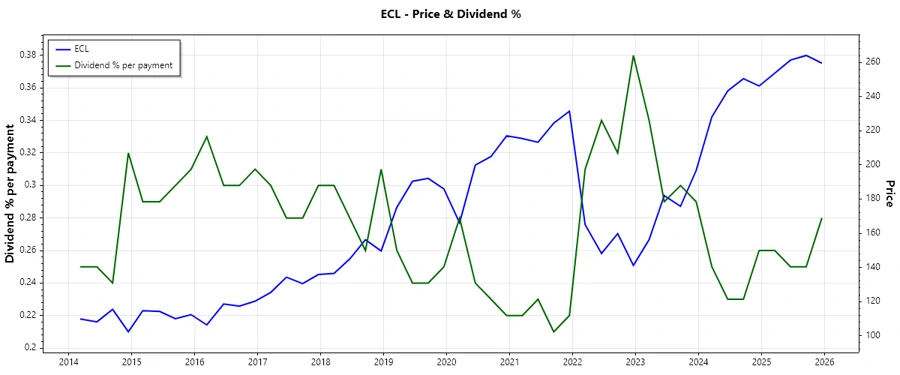
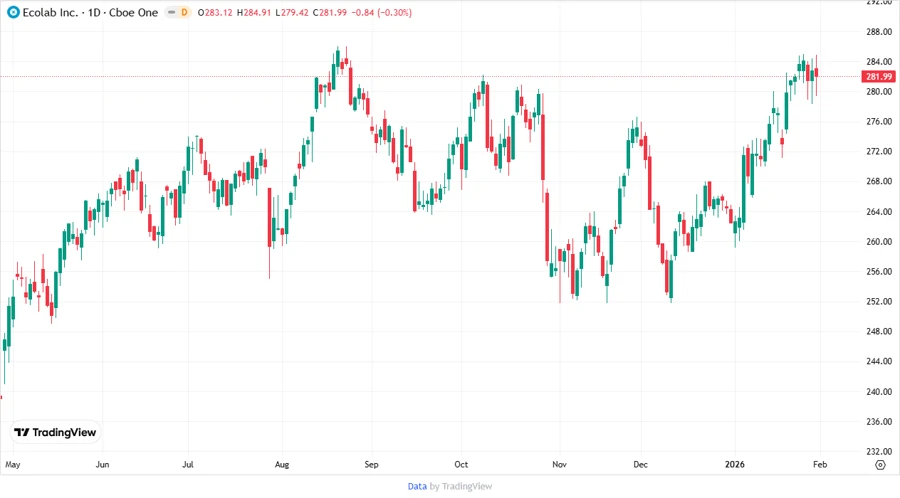
Price Development 📈
Dividend Scoring System ✅
| Category | Description | Score | Scale |
|---|---|---|---|
| Dividend yield | Moderate yield with stable growth. | 3 | |
| Dividend Stability | Continual increases over 4 decades. | 5 | |
| Dividend growth | Modest but consistent increases. | 4 | |
| Payout ratio | Sensible and sustainable levels. | 4 | |
| Financial stability | Robust balance sheet and liquidity. | 5 | |
| Dividend continuity | No cuts since 1987. | 5 | |
| Cashflow Coverage | Efficient cashflow utilization. | 4 | |
| Balance Sheet Quality | Strong leverage and asset management. | 5 |
Total Score: 35/40
Rating 📈
Based on the comprehensive dividend analysis, Ecolab Inc. is rated as a solid choice for dividend investors seeking stability with moderate growth potential. The company’s financial discipline and focus on innovation reinforce its ability to sustain and enhance shareholder value.
Smart Data Insight
Master the Perfect Entry & Exit for this Stock
Don't leave your profits to chance. Historically, this stock follows specific seasonal patterns that institutional traders use to maximize returns.
- ✅ Identify the "Golden Buying Window"
- ✅ Avoid high-risk correction cycles
- ✅ Backtested data from the last 20+ years