July 26, 2025 a 02:46 am


ECL: Dividend Analysis - Ecolab Inc.
Ecolab Inc. stands out in the sector with a focus on sustainable dividends, having maintained a consistent payout over four decades. Its dividend growth and yield indicate a robust capacity to return capital to shareholders while maintaining financial health. The company's disciplined approach to dividend distribution underscores its stability in volatile markets. Investors might consider Ecolab as a reliable dividend stock given its consistent history and strategic financial management.
📊 Overview
Ecolab belongs to a defensive sector, offering a reliable dividend yield of 0.96%. The current dividend per share stands at $2.34, with an impressive history of 41 years without cuts, demonstrating Ecolab's resolute commitment to its shareholders.
| Sector | Dividend Yield | Current Dividend Per Share | Dividend History | Last Cut or Suspension |
|---|---|---|---|---|
| Consumer Goods | 0.96% | 2.34 USD | 41 years | None |
📈 Dividend History
The uninterrupted dividend history of 41 years signifies Ecolab's enduring commitment to rewarding its shareholders. This stability can be seen as a strong foundation for potential investors seeking steady income.
| Year | Dividend Per Share (USD) |
|---|---|
| 2025 | 1.30 |
| 2024 | 2.36 |
| 2023 | 2.16 |
| 2022 | 2.06 |
| 2021 | 1.95 |
📈 Dividend Growth
Ecolab's dividend has shown a steady growth over the years, with a 3-year growth rate of 6.57% and a 5-year growth rate of 4.99%. Consistent growth in dividends reflects positively on management's promise to enhance shareholder value.
| Time | Growth |
|---|---|
| 3 years | 6.57% |
| 5 years | 4.99% |
The average dividend growth is 4.99% over 5 years. This shows moderate but steady dividend growth.
⚖️ Payout Ratio
The analysis of payout ratios, both EPS-based and Free Cash Flow-based, is crucial for evaluating the sustainability of dividends. Ecolab Inc. maintains a low EPS-based payout ratio of 31.49%, indicating ample room to cover and potentially raise dividends.
| Key Figure | Ratio |
|---|---|
| EPS-based | 31.49% |
| Free Cash Flow-based | 44.08% |
With a payout ratio of 31.49% based on EPS, Ecolab is in a comfortable position to maintain its dividends, whereas a 44.08% payout based on Free Cash Flow shows it effectively manages cash for sustaining dividend distributions.
💰 Cashflow & Capital Efficiency
Analyzing cash flow and capital efficiency is key to understanding the company's ability to generate cash in relation to its operational and financial obligations. Ecolab demonstrates noteworthy capital efficiency with a solid Free Cash Flow Yield of 1.95% and a CAPEX to Operating Cash Flow ratio of 40.68%.
| Metric | 2024 | 2023 | 2022 |
|---|---|---|---|
| Free Cash Flow Yield | 2.73% | 2.90% | 2.59% |
| Earnings Yield | 3.17% | 2.43% | 2.63% |
| CAPEX to Operating Cash Flow | 35.34% | 32.13% | 39.86% |
| Stock-based Compensation to Revenue | 0.85% | 0.62% | 0.62% |
| Free Cash Flow / Operating Cash Flow Ratio | 64.66% | 67.87% | 60.14% |
Ecolab maintains strong cash flow stability and capital efficiency, signifying its adeptness at generating and allocating capital efficiently to maximize shareholder returns.
🏦 Balance Sheet & Leverage Analysis
Comprised of leverage and liquidity metrics, the balance sheet analysis helps gauge Ecolab’s financial resilience. Notably, the debt to equity ratio is at 0.95, reflecting balanced debt management.
| Metric | 2024 | 2023 | 2022 |
|---|---|---|---|
| Debt-to-Equity | 0.95 | 1.09 | 1.23 |
| Debt-to-Assets | 0.37 | 0.40 | 0.42 |
| Debt-to-Capital | 0.49 | 0.52 | 0.55 |
| Net Debt to EBITDA | 1.83 | 2.58 | 2.99 |
| Current Ratio | 1.32 | 1.30 | 1.30 |
| Quick Ratio | 0.95 | 0.95 | 0.88 |
| Financial Leverage | 2.56 | 2.72 | 2.97 |
Ecolab’s balance sheet indicates strong leverage management and liquidity, with metrics supporting its ability to uphold its financial commitments and navigate future uncertainties.
📊 Fundamental Strength & Profitability
Measuring Ecolab’s profitability entails examining profit margins and returns. The company exhibits strong profitability with a notably high Return on Equity (RoE) of 24% in 2024, illustrating effective use of equity capital.
| Metric | 2024 | 2023 | 2022 |
|---|---|---|---|
| Return on Equity | 24.12% | 17.06% | 15.09% |
| Return on Assets | 9.44% | 6.28% | 5.09% |
| Net Profit Margin | 13.42% | 8.96% | 7.69% |
| EBIT Margin | 18.50% | 13.74% | 11.25% |
| EBITDA Margin | 24.43% | 19.80% | 19.64% |
| Research & Development to Revenue | 0.00% | 1.25% | 1.34% |
Ecolab provides impressive profitability metrics, highlighting its proficient cost management and resourceful reinvestment strategies to sustain growth momentum.
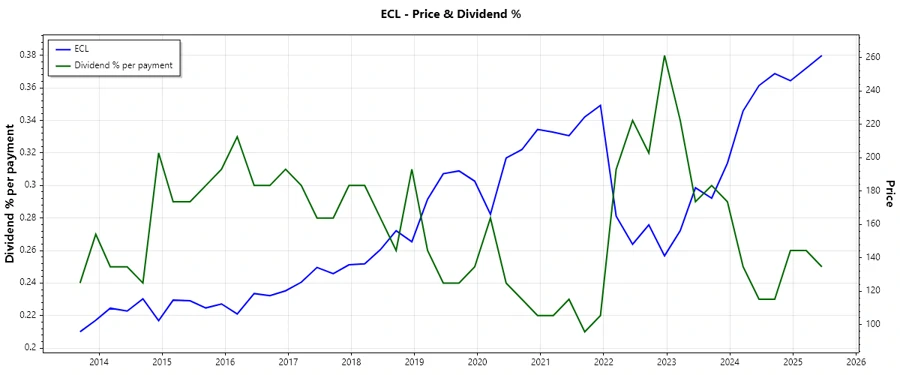
📉 Price Development
🏆 Dividend Scoring System
| Criterion | Points | Score Bar |
|---|---|---|
| Dividend yield | 3 | |
| Dividend Stability | 5 | |
| Dividend growth | 4 | |
| Payout ratio | 4 | |
| Financial stability | 5 | |
| Dividend continuity | 5 | |
| Cashflow Coverage | 4 | |
| Balance Sheet Quality | 4 |
Total Score: 34/40
🎯 Rating
Based on an aggregate analysis of key financial metrics and scoring criteria, Ecolab is strongly positioned as a dependable investment choice for dividend-focused portfolios. Its robust financial health and strategic allocation policies ensure that dividends remain stable and progressive, offering a commendable recommendation for investors prioritizing long-term dividend growth and stable returns.
Smart Data Insight
Master the Perfect Entry & Exit for this Stock
Don't leave your profits to chance. Historically, this stock follows specific seasonal patterns that institutional traders use to maximize returns.
- ✅ Identify the "Golden Buying Window"
- ✅ Avoid high-risk correction cycles
- ✅ Backtested data from the last 20+ years