August 05, 2025 a 04:03 am

EBAY: Trend and Support & Resistance Analysis - eBay Inc.
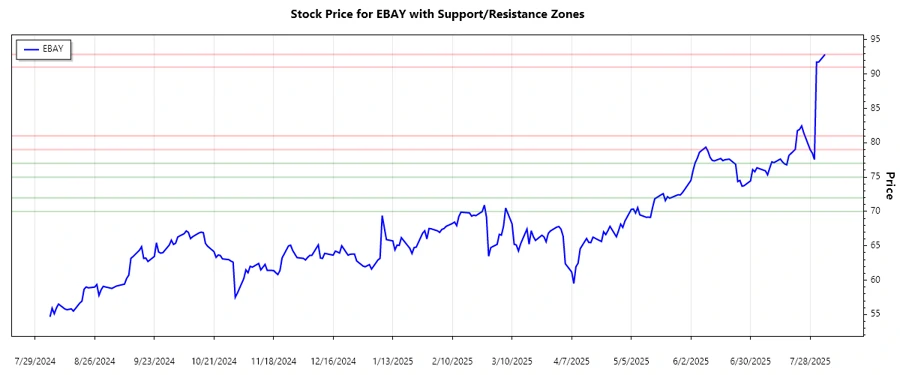
eBay Inc.'s stock demonstrates a significant recovery from its prior downturn, indicating resilience in its market operation. As a leading platform connecting buyers and sellers globally, eBay's price movements reflect adaptability and consumer engagement habits. The current analysis indicates an emerging bullish trend, supported by key technical indicators and potential market optimism.
Trend Analysis
This analysis is focused on assessing eBay Inc.'s stock performance through EMA20 and EMA50 indicators to identify the prevalent trend in the recent data sample.
| Date | Close Price | Trend |
|---|---|---|
| 2025-08-04 | $92.86 | ▲ Uptrend |
| 2025-08-01 | $91.74 | ▲ Uptrend |
| 2025-07-31 | $91.75 | ▲ Uptrend |
| 2025-07-30 | $77.56 | ▲ Uptrend |
| 2025-07-29 | $78.50 | ▲ Uptrend |
| 2025-07-28 | $79.00 | ▲ Uptrend |
| 2025-07-25 | $81.43 | ▲ Uptrend |
The closing price data above shows an emerging upward momentum confirmed by EMA indicators positioning EMA20 significantly above EMA50. eBay Inc. stock seems to enter a bullish phase, suggesting investor confidence.
Support and Resistance
To understand the strategic price levels, two main resistance and support zones are calculated from historical data.
| Zone Type | From | To | Direction |
|---|---|---|---|
| Resistance Zone 1 | $79.00 | $81.00 | ▲ |
| Resistance Zone 2 | $91.00 | $92.86 | ▲ |
| Support Zone 1 | $75.00 | $77.00 | ▼ |
| Support Zone 2 | $70.00 | $72.00 | ▼ |
The current stock price navigates within the first resistance zone. This implies possible testing of higher resistance levels with the current upward momentum.
Conclusion
The recent technical analysis on eBay Inc. suggests an optimistic picture as it enters an uptrend. The customer's sustained trust in eBay’s marketplace amidst growing competition indicates strong business fundamentals. However, potential resistance levels could challenge the upward trajectory. Analysts should closely monitor these technical levels and any fundamental changes in consumer behavior or competitive actions that might impact the company's market standing.
Smart Data Insight
Master the Perfect Entry & Exit for this Stock
Don't leave your profits to chance. Historically, this stock follows specific seasonal patterns that institutional traders use to maximize returns.
- ✅ Identify the "Golden Buying Window"
- ✅ Avoid high-risk correction cycles
- ✅ Backtested data from the last 20+ years