December 13, 2025 a 06:44 am
EBAY: Fibonacci Analysis - eBay Inc.
eBay Inc. has experienced significant price fluctuations in recent months. From technical perspectives, trends in eBay's stock reveal important underlying dynamics. The analysis suggests eBay's current stock movement is influenced by broader market conditions, and attention should focus on potential resistance and support levels observed in recent trading sessions.
Fibonacci Analysis
| Trend Period | High (Date) | Low (Date) | Fibonacci Levels | Current Price | Retracement Zone |
|---|---|---|---|---|---|
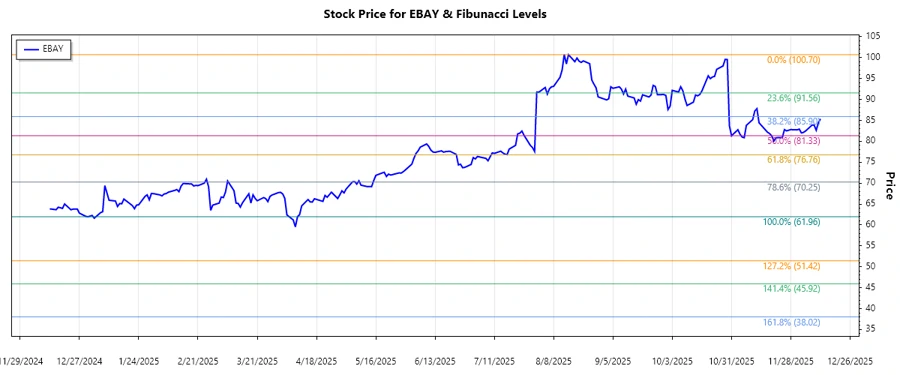
| August 15, 2025 - December 12, 2025 | $100.70 (August 15, 2025) | $61.96 (April 9, 2025) |
|
$85.36 (December 12, 2025) | 0.382 |
The current price of eBay Inc. sits in the 0.382 retracement zone, indicating a potential resistance level. Traders might see this area as a consolidation phase before determining future price directions.
Conclusion
eBay's stock presents a range of opportunities and risks amid its currently observed retracement. Investors should be cautious of the apparent resistance at the 0.382 level. A breakthrough or rejection at this level could signal future price directions. The stock remains attractive for those with a bullish outlook, conditioned on key economic indicators supporting growth. However, caution is advised given the potential for downward pressure influenced by broader market activities.