November 19, 2025 a 04:44 pm

EBAY: Fibonacci Analysis - eBay Inc.
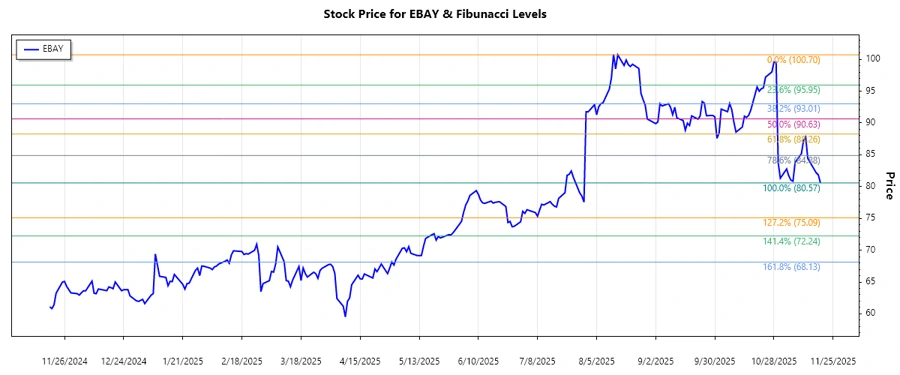
eBay Inc. has shown a significant decline in its stock price over the recent months, raising technical concerns among investors. The stock has been in a downtrend from its peak in August to the depths of its current price range in November. This analysis explores the potential Fibonacci retracement levels that can provide insights into possible support or resistance levels. Investors should cautiously watch for these levels to understand potential reversal points.
Fibonacci Analysis
| Metric | Details |
|---|---|
| Trend Start Date | 2025-08-15 |
| Trend End Date | 2025-11-19 |
| High Point | $100.70 on 2025-08-15 |
| Low Point | $80.57 on 2025-11-19 |
| Fibonacci Level 0.236 | $86.36 |
| Fibonacci Level 0.382 | $89.15 |
| Fibonacci Level 0.5 | $90.64 |
| Fibonacci Level 0.618 | $92.13 |
| Fibonacci Level 0.786 | $94.19 |
| Current Price | $80.57 |
| Retracement Zone | None |
| Technical Interpretation | The current price is below all the retracement levels, indicating strong downward pressure. $86.36 could act as the nearest resistance if a retracement occurs. |
Conclusion
eBay Inc.'s stock is currently experiencing downward pressure, continuing a declining trend observed since mid-August. The current price is below significant Fibonacci retracement levels, indicating a potential resistance around $86.36 in case of upward momentum. For analysts, careful observation of the upcoming market movements is crucial for identifying any signs of reversal. If the stock manages to breach the $86.36 resistance level, it could signify a shift in market sentiment. However, the ongoing negative sentiment poses risks, potentially leading to further declines if support levels are not established.
Smart Data Insight
Master the Perfect Entry & Exit for this Stock
Don't leave your profits to chance. Historically, this stock follows specific seasonal patterns that institutional traders use to maximize returns.
- ✅ Identify the "Golden Buying Window"
- ✅ Avoid high-risk correction cycles
- ✅ Backtested data from the last 20+ years