November 05, 2025 a 10:15 am

EBAY: Fibonacci Analysis - eBay Inc.
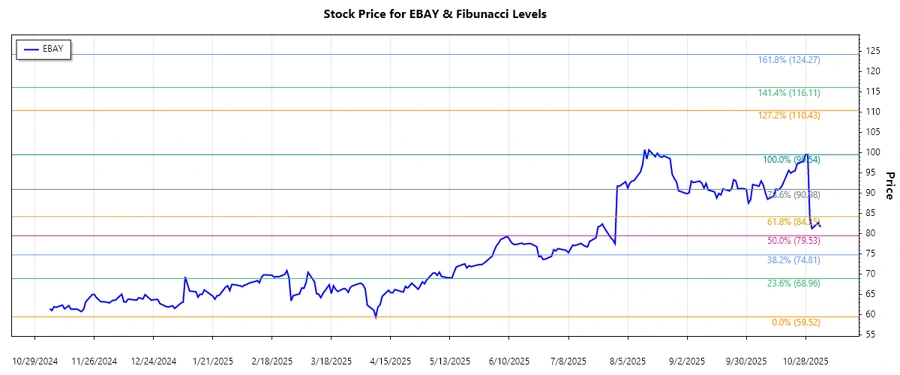
Over the past few months, eBay Inc. has shown a significant trend in its stock price. The company, known for its global online marketplace presence, has experienced fluctuations due to market dynamics and ecommerce growth prospects. Based in San Jose, California, eBay's vast suite of mobile apps continues to connect buyers and sellers around the world. Analyzing the recent trends can provide important insights into potential support and resistance levels crucial for investors.
Fibonacci Analysis
| Start Date | End Date | High Price (Date) | Low Price (Date) |
|---|---|---|---|
| 2024-11-05 | 2025-10-29 | 99.54 (2025-10-29) | 59.52 (2025-04-08) |
Fibonacci Levels
| Level | Price |
|---|---|
| 0.236 | 70.47 |
| 0.382 | 76.01 |
| 0.5 | 79.53 |
| 0.618 | 83.06 |
| 0.786 | 88.41 |
Currently, the stock is trading near a retracement level of 0.5 (79.53). This suggests a potential area of support where buying interest might increase.
In technical terms, if the support at the 0.5 level holds, it could indicate a continuation of the upward trend, whereas a break below might mark a shift in market sentiment.
Conclusion
The recent analysis of eBay Inc. stock indicates a strong upward trend with significant support at the 79.53 level. Investors might find this as an opportune entry point should the support hold. However, a fall below this level could pose risks of further declines. Given eBay’s strategic market position and increasing digital expansion, the prospects for growth seem positive, though macroeconomic factors need consideration. Continuous monitoring of price movements and market news is recommended for investors looking to leverage technical indicators for trading opportunities.
Smart Data Insight
Master the Perfect Entry & Exit for this Stock
Don't leave your profits to chance. Historically, this stock follows specific seasonal patterns that institutional traders use to maximize returns.
- ✅ Identify the "Golden Buying Window"
- ✅ Avoid high-risk correction cycles
- ✅ Backtested data from the last 20+ years