June 15, 2026 a 07:31 am


EBAY: Dividend Analysis - eBay Inc.
eBay Inc. presents a modest dividend yield, reflective of its prudent and steady dividend policy. Over recent years, the company's payout ratio has remained conservative, allowing for potential capital reinvestment in its digital marketplace infrastructure. The company's robust cash flow coverage further strengthens its dividend sustainability, positioning eBay as a reliable income-generating investment.
📊 Overview
| Metric | Details |
|---|---|
| Sector | Consumer Services |
| Dividend yield | 1.10 % |
| Current dividend per share | 1.18 USD |
| Dividend history | 8 years |
| Last cut or suspension | None |
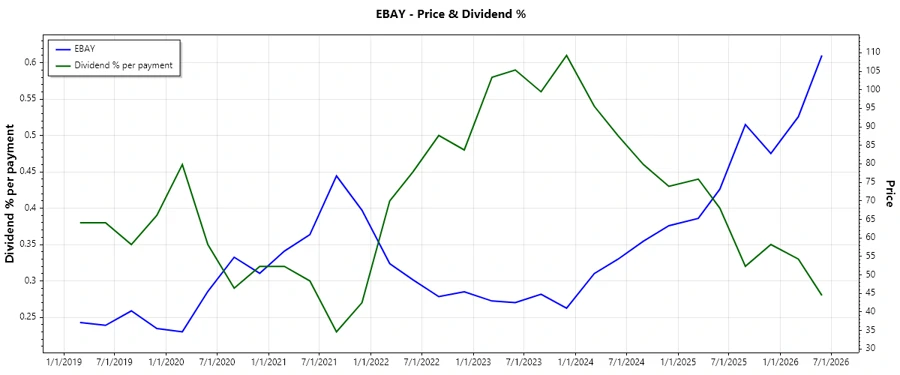
📈 Dividend History
eBay's consistent dividend payouts over the last 8 years affirm its commitment towards rewarding shareholders. Tracking the company's past dividend payments can provide insight into its future dividend sustainability and its financial health.
| Year | Dividend per Share |
|---|---|
| 2026 | 0.62 |
| 2025 | 1.16 |
| 2024 | 1.08 |
| 2023 | 1.00 |
| 2022 | 0.88 |
🗣️ Dividend Growth
Understanding the growth trajectory of dividends is essential to evaluate potential returns. eBay Inc.'s dividend growth in the past few years showcases its ability to enhance shareholder value and profitability.
| Time | Growth |
|---|---|
| 3 years | 9.65 % |
| 5 years | 12.63 % |
The average dividend growth is 12.63 % over 5 years. This shows moderate but steady dividend growth.
✅ Payout Ratio
The payout ratio provides insight into dividend sustainability. A lower payout ratio typically indicates a higher potential for future dividend increases or other capital returns.
| Key figure | Ratio |
|---|---|
| EPS-based | 25.86 % |
| Free cash flow-based | 30.97 % |
eBay's EPS payout ratio of 25.86 % and FCF-based payout ratio of 30.97 % demonstrate prudent financial management, allowing flexibility for future dividend increases and reinvestment opportunities.
📊 Cashflow & Capital Efficiency
eBay Inc. effectively converts its earnings into free cash flows, indicating sound operational efficiency. Analyzing cash flows in conjunction with capital expenditures provides a holistic picture of capital efficiency.
| Metric | 2025 | 2024 | 2023 |
|---|---|---|---|
| Free Cash Flow Yield | 4.23 % | 6.37 % | 8.52 % |
| Earnings Yield | 5.17 % | 6.43 % | 11.97 % |
| CAPEX to Operating Cash Flow | 24.02 % | 18.97 % | 18.80 % |
| Stock-based Compensation to Revenue | – | 5.72 % | 5.69 % |
| Free Cash Flow / Operating Cash Flow Ratio | 75.98 % | 81.02 % | 81.20 % |
eBay's consistent cash flow generation and efficient capital allocation contribute to a strong liquidity position and sustainable dividend payments over the long term.
💳 Balance Sheet & Leverage Analysis
Analyzing eBay's leverage ratios provides insight into the company's financial stability and risk management strategies. A balanced debt structure correlates to financial health and capacity to meet obligations.
| Metric | 2025 | 2024 | 2023 |
|---|---|---|---|
| Debt-to-Equity | 1.60 | 1.52 | 1.29 |
| Debt-to-Assets | 41.89 % | 40.60 % | 38.06 % |
| Debt-to-Capital | 61.51 % | 60.39 % | 56.26 % |
| Net Debt to EBITDA | 1.93 | 1.78 | 1.42 |
| Current Ratio | 1.22 | 1.24 | 2.44 |
| Quick Ratio | 1.10 | 1.24 | 2.44 |
| Financial Leverage | 3.82 | 3.75 | 3.38 |
eBay Inc. manages debt prudently, maintaining a balance that ensures liquidity while avoiding over-leverage risk, reflected in its improving debt-to-equity ratio.
📙 Fundamental Strength & Profitability
Understanding metrics like return on equity and profit margins is important as they indicate how well eBay converts its revenues into profits, thus demonstrating operational effectiveness.
| Metric | 2025 | 2024 | 2023 |
|---|---|---|---|
| Return on Equity | 44.01 % | 38.29 % | 43.26 % |
| Return on Assets | 11.53 % | 10.20 % | 12.80 % |
| Net Margin | 18.30 % | 19.20 % | 27.36 % |
| EBIT Margin | 23.00 % | 24.67 % | 39.26 % |
| EBITDA Margin | 25.68 % | 27.82 % | 43.25 % |
| Gross Margin | 71.45 % | 71.99 % | 71.98 % |
| R&D to Revenue | 14.79 % | 14.38 % | 15.27 % |
eBay Inc. demonstrates strong profitability metrics, reflected in high returns on equity and robust margins, essential for achieving long-term operational success and shareholder value creation.
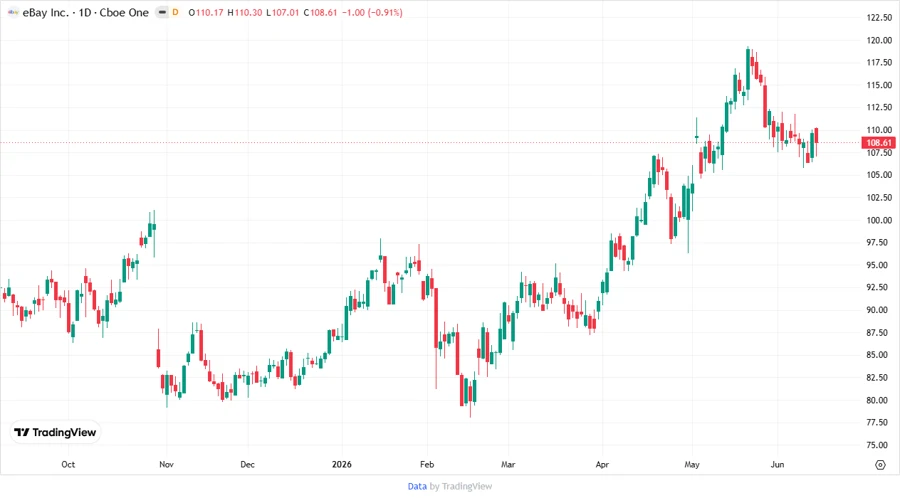
🛠️ Price Development
📝 Dividend Scoring System
| Category | Score | Visual |
|---|---|---|
| Dividend yield | 3 | |
| Dividend Stability | 4 | |
| Dividend growth | 3 | |
| Payout ratio | 4 | |
| Financial stability | 4 | |
| Dividend continuity | 4 | |
| Cashflow Coverage | 4 | |
| Balance Sheet Quality | 4 |
Total Score: 30/40
📣 Rating
eBay Inc. is recommended as a 'Buy' for dividend-focused investors seeking both reliable income and the potential for moderate capital appreciation. The company’s disciplined financial management and consistent payout record foster confidence in its continued growth trajectory and shareholder returns.
Smart Data Insight
Master the Perfect Entry & Exit for this Stock
Don't leave your profits to chance. Historically, this stock follows specific seasonal patterns that institutional traders use to maximize returns.
- ✅ Identify the "Golden Buying Window"
- ✅ Avoid high-risk correction cycles
- ✅ Backtested data from the last 20+ years