March 20, 2026 a 03:31 am

EBAY: Dividend Analysis - eBay Inc.
eBay Inc., a titan in the e-commerce landscape, offers a measured dividend profile. With a current market cap of approximately $41 billion, eBay's financial strategy has consistently reflected stability and gradual growth. Despite its relatively modest dividend yield, the company's consistent dividend history and growth portray a commitment to returning value to shareholders over time. As we delve deeper into eBay's financials, it becomes evident that the balance between reinvestment in growth and shareholder returns is a keystone of its fiscal philosophy.
📊 Overview
Understanding the dividend profile of eBay Inc. is crucial for investors who prioritize steady income. Here is an overview of the core statistics:
| Metric | Value |
|---|---|
| Sector | Technology |
| Dividend Yield | 1.27% |
| Current Dividend per Share | 1.18 USD |
| Dividend History | 8 years |
| Last Cut or Suspension | None |
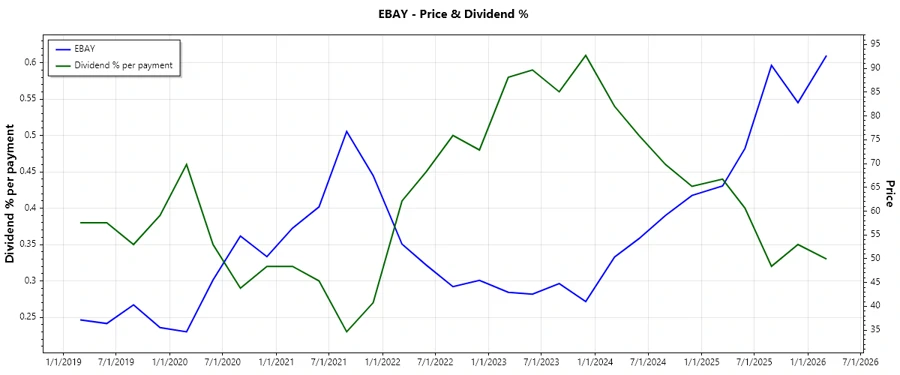
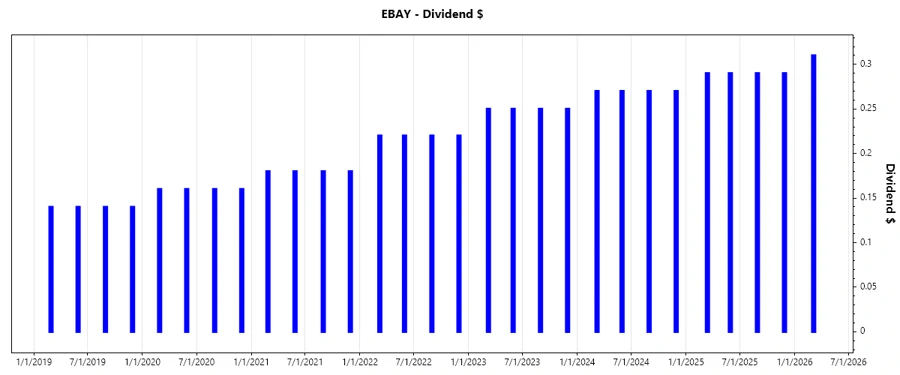
🕰️ Dividend History
eBay Inc. has demonstrated consistent dividend payments over the past decade, indicative of its stable financial health and commitment to delivering shareholder returns.
| Year | Dividend Per Share (USD) |
|---|---|
| 2026 | 0.31 |
| 2025 | 1.16 |
| 2024 | 1.08 |
| 2023 | 1.00 |
| 2022 | 0.88 |
📈 Dividend Growth
The analysis of eBay's dividend growth over recent years presents insights into the company’s dedication towards enhancing shareholder value. A rising dividend per share often signals confidence in ongoing earnings strength.
| Time | Growth |
|---|---|
| 3 years | 9.65% |
| 5 years | 12.63% |
The average dividend growth is 12.63% over 5 years. This shows moderate but steady dividend growth.
🗣️ Payout Ratio
The payout ratios provide insights into the sustainability of eBay's dividend payments and the balance between returning cash to shareholders and reinvesting in growth opportunities.
| Key Figure | Ratio |
|---|---|
| EPS-based | 26.14% |
| Free Cash Flow-based | 37.11% |
The relatively low payout ratios of 26.14% (EPS) and 37.11% (FCF) indicate that eBay retains a substantial portion of its earnings, providing flexibility for growth investments.
💸 Cashflow & Capital Efficiency
Analyzing the cash flow and capital efficiency metrics is crucial to understanding how effectively eBay converts sales into liquid assets and optimally employs its capital.
| Metric | 2023 | 2024 | 2025 |
|---|---|---|---|
| Free Cash Flow Yield | 8.52% | 6.37% | 4.23% |
| Earnings Yield | 11.97% | 6.43% | 5.17% |
| CAPEX to Operating Cash Flow | 18.80% | 18.97% | 24.02% |
| Stock-based Compensation to Revenue | 5.69% | 5.72% | - |
| Free Cash Flow / Operating Cash Flow Ratio | 81.20% | 81.03% | 75.98% |
The cash flow metrics reflect a robust operational efficiency, with the Free Cash Flow Yield and Earnings Yield indicating strong profitability relative to eBay's capital structure.
📊 Balance Sheet & Leverage Analysis
eBay's leverage metrics are imperative for assessing the company's financial stability, solvency, and ability to meet its long-term obligations.
| Metric | 2023 | 2024 | 2025 |
|---|---|---|---|
| Debt-to-Equity | 128.64% | 152.44% | 159.83% |
| Debt-to-Assets | 38.06% | 40.60% | 41.89% |
| Debt-to-Capital | 56.26% | 60.39% | 61.51% |
| Net Debt to EBITDA | 1.42 | 1.78 | 1.93 |
| Current Ratio | 2.44 | 1.24 | 1.10 |
| Quick Ratio | 2.44 | 1.24 | 1.10 |
| Financial Leverage | 338.02% | 375.44% | 381.58% |
The relatively high levels of leverage suggest that while eBay's aggressive capital strategy might support growth, it is crucial to monitor for potential liquidity concerns.
🧮 Fundamental Strength & Profitability
The following financial metrics highlight eBay's efficiency in generating profits and its productivity in utilizing assets and equity.
| Metric | 2023 | 2024 | 2025 |
|---|---|---|---|
| Return on Equity | 43.26% | 38.29% | 44.01% |
| Return on Assets | 12.80% | 10.20% | 11.53% |
| Margins: Net | 27.36% | 19.21% | 18.30% |
| EBIT | 39.26% | 24.67% | 23.00% |
| EBITDA | 43.25% | 27.82% | 25.68% |
| Gross | 71.98% | 71.99% | 71.45% |
| Research & Development to Revenue | 15.27% | 14.38% | 14.79% |
eBay's underlying profitability metrics demonstrate efficient operations, particularly with its strong Return on Equity and robust gross margins indicative of competitive value generation.
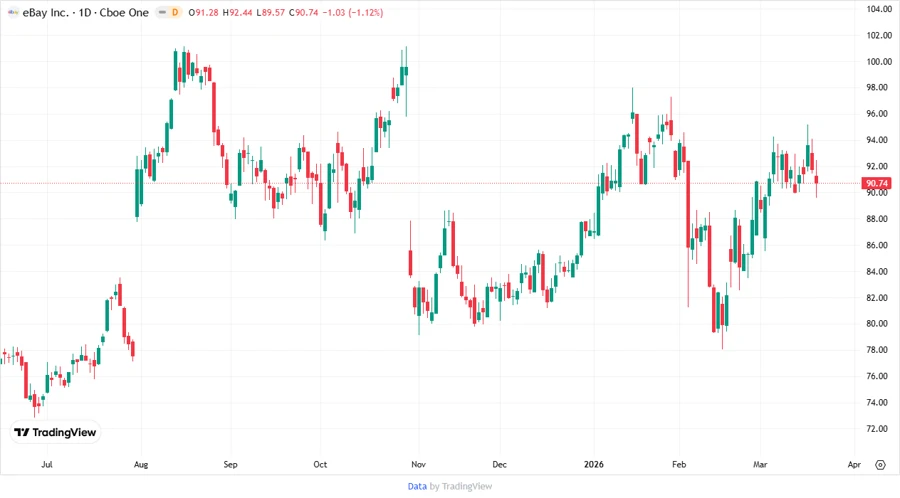
📈 Price Development
✅ Dividend Scoring System
Evaluating eBay's cash and dividend performance through a scoring system helps identify its strengths and weaknesses compared to industry standards:
| Category | Score | |
|---|---|---|
| Dividend Yield | 3 | |
| Dividend Stability | 4 | |
| Dividend Growth | 4 | |
| Payout Ratio | 5 | |
| Financial Stability | 3 | |
| Dividend Continuity | 5 | |
| Cashflow Coverage | 4 | |
| Balance Sheet Quality | 4 |
Total Score: 32/40
🗣️ Rating
eBay Inc. presents a stable investment with a secure dividend history and favorable growth prospects, especially for those seeking moderate but steady income. Taking into account the comprehensive dividend scoring and financial robustness, eBay is well-positioned for those valuing reliability with a focus on future stability.