June 17, 2025 a 01:15 pm

EA: Trend and Support & Resistance Analysis - Electronic Arts Inc.
Electronic Arts Inc. is a prominent player in the gaming industry, offering a diverse portfolio of games across different platforms. The company's performance in the stock market mirrors the competitive and dynamic nature of its business environment. As we analyze recent trends and support/resistance levels, the insights are crucial for investors making strategic decisions about EA's stock.
Trend Analysis
| Date | Close Price | Trend |
|---|---|---|
| 2025-06-16 | $151.1 | ▲ |
| 2025-06-13 | $148.48 | ▼ |
| 2025-06-12 | $150.05 | ▲ |
| 2025-06-11 | $147.68 | ▼ |
| 2025-06-10 | $147.16 | ▼ |
| 2025-06-09 | $146.92 | ▼ |
| 2025-06-06 | $149.57 | ▲ |
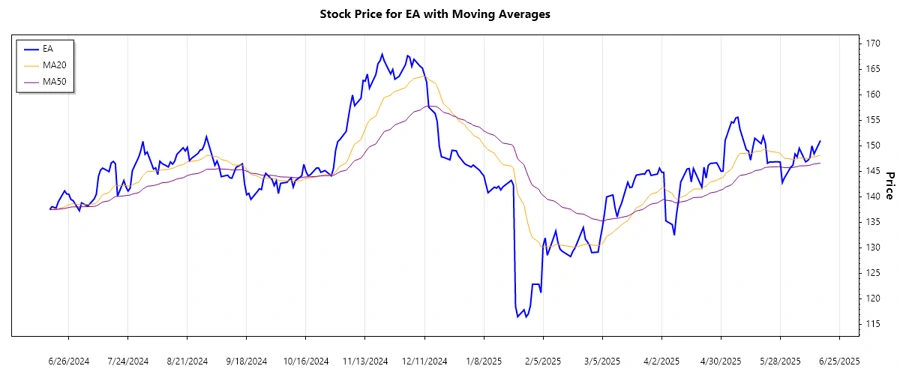
The recent trend shows mixed signals with alternating up and down days. However, the EMA analysis indicates a slight upward shift with EMA20 slightly crossing EMA50.
Support and Resistance
| Zone Type | From | To |
|---|---|---|
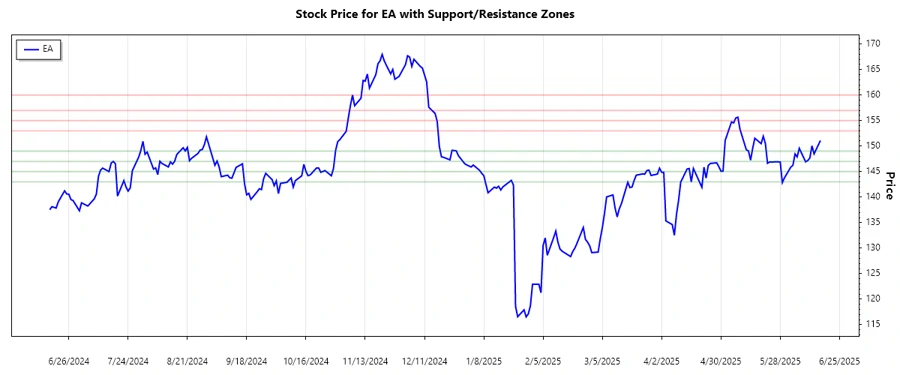
| Support Zone 1 | ⚊ $147 | ⚊ $149 |
| Support Zone 2 | ⚊ $143 | ⚊ $145 |
| Resistance Zone 1 | ⚉ $153 | ⚉ $155 |
| Resistance Zone 2 | ⚉ $157 | ⚉ $160 |
Currently, the price is close to the first support zone, indicating a potential bounce if the trend doesn't break downward.
Conclusion
The EA stock exhibits a complex pattern with potential for short-term gains upon support zone testing. Analysts should watch these levels closely as they could provide opportunities for strategic entry points. However, the current market conditions warrant cautious optimism, with attention to changing fundamentals and industry dynamics.