
July 17, 2026 a 06:44 am
EA: Fibonacci Analysis - Electronic Arts Inc.
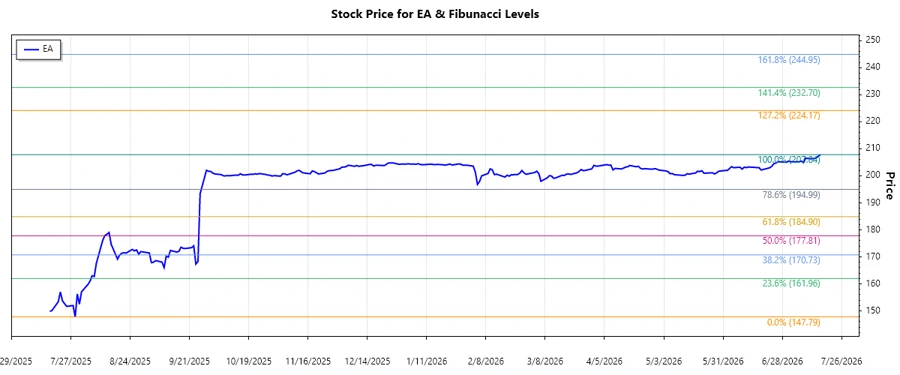
Electronic Arts Inc. (EA) has demonstrated a consistent growth trajectory in recent months, showing potential for future gains. As a leader in interactive entertainment, EA continues to leverage its extensive portfolio of franchises to engage a global audience. With a commitment to innovation and expanding digital presence, EA is poised to capitalize on emerging trends in the gaming industry.
Fibonacci Analysis
| Factor | Details |
|---|---|
| Start Date | 2025-07-29 |
| End Date | 2026-07-16 |
| Highest Price | $207.84 on 2026-07-16 |
| Lowest Price | $147.79 on 2025-07-29 |
| Fibonacci Level | Price |
|---|---|
| 0.236 | $161.75 |
| 0.382 | $173.43 |
| 0.500 | $177.82 |
| 0.618 | $188.72 |
| 0.786 | $199.06 |
The current price is within the 0.786 Retracement Zone, indicating potential support at this level. This level could serve as a solid foundation if the price retraces.
Conclusion
Electronic Arts Inc. remains a robust player in the gaming industry, with a recent uptrend substantiating its market strength. The Fibonacci analysis shows EA stock within the 0.786 retracement level, indicating a potential support zone. If the stock can maintain this level, it suggests solid potential for a continuation of the trend. However, investors should remain cautious of sector fluctuations and potential market corrections. The strategic expansion of EA's digital platforms provides opportunities for growth, yet competition in the gaming industry may impact pricing and market share.
Smart Data Insight
Master the Perfect Entry & Exit for this Stock
Don't leave your profits to chance. Historically, this stock follows specific seasonal patterns that institutional traders use to maximize returns.
- ✅ Identify the "Golden Buying Window"
- ✅ Avoid high-risk correction cycles
- ✅ Backtested data from the last 20+ years