
May 26, 2026 a 06:44 am
EA: Fibunacci Analysis - Electronic Arts Inc.
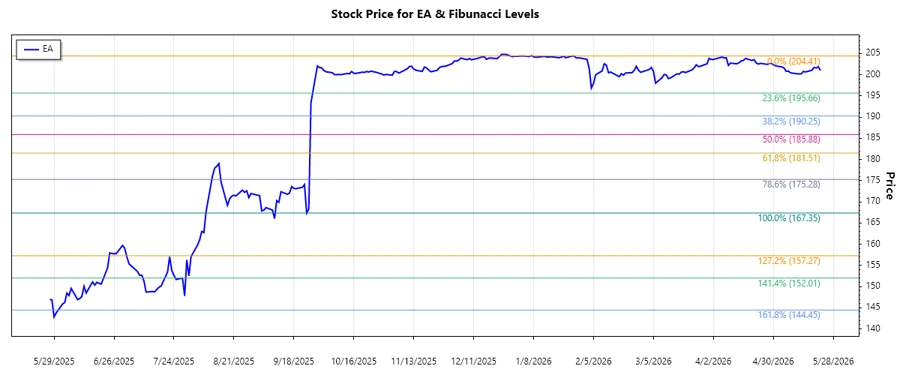
Electronic Arts Inc. (EA), known for its wide array of game titles, has experienced varied stock movements. Over recent months, the stock has predominantly shown a downward trend, potentially opening opportunities for market participants as prices reach potential support levels.
Fibonacci Analysis
| Analysis Detail | Value |
|---|---|
| Trend Start Date | 2025-07-01 |
| Trend End Date | 2025-09-26 |
| High Price & Date | $204.41 on 2025-10-02 |
| Low Price & Date | $167.35 on 2025-09-24 |
| Retracement Level | Price Level |
|---|---|
| 0.236 | $175.17 |
| 0.382 | $181.03 |
| 0.500 | $185.88 |
| 0.618 | $190.74 |
| 0.786 | $197.38 |
The current price at $200.97 is above the 0.786 retracement level, suggesting it is not in a typical retracement zone.
Technically, the price suggests potential resistance levels as it approaches higher retracement zones, indicating careful monitoring.
Conclusion
The technical analysis of Electronic Arts Inc. indicates a predominantly downward trend over the analyzed period. Current levels, being above most Fibonacci retracement zones, may face resistance, suggesting potential volatility. As Electronic Arts continues to leverage its gaming portfolio, both opportunities and risks lie in how market perceptions adjust to new developments. Thorough analysis and strategic planning are essential for investors looking to navigate EA's stock movements.
Smart Data Insight
Master the Perfect Entry & Exit for this Stock
Don't leave your profits to chance. Historically, this stock follows specific seasonal patterns that institutional traders use to maximize returns.
- ✅ Identify the "Golden Buying Window"
- ✅ Avoid high-risk correction cycles
- ✅ Backtested data from the last 20+ years