September 08, 2025 a 05:15 am

EA: Fibonacci Analysis - Electronic Arts Inc.
Electronic Arts Inc. (EA) has been a pivotal player in the gaming industry with a diverse portfolio of popular gaming titles. Over the past few months, the stock has shown considerable volatility. Most recently, the stock displayed an upward trend, which provides an opportunity for technical analysis to discover potential upcoming price levels. This analysis takes a deeper look into the trend using Fibonacci retracement levels to offer insights into future price movements and potential support or resistance zones. Investors may consider these technical indicators to make informed decisions.
Fibonacci Analysis
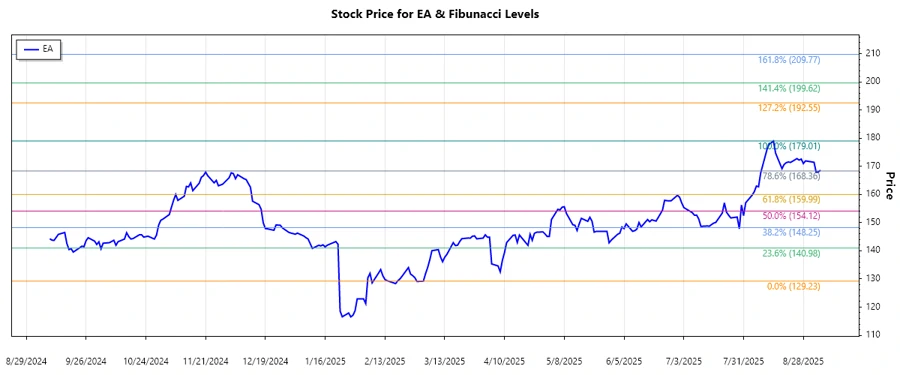
Analyzing the recent upward trend in EA stock from 2025-03-03 to 2025-08-14 shows significant price movement peaking at $179.01. Fibonacci retracement levels give insights into potential support and resistance levels as the stock price retraces from this high.
| Item | Detail |
|---|---|
| Start Date | 2025-03-03 |
| End Date | 2025-08-14 |
| High Price (Date) | $179.01 (2025-08-14) |
| Low Price (Date) | $129.23 (2025-03-03) |
| Fibonacci Levels |
|
| Retracement Zone | 0.236 |
| Interpretation | The current price of $168.62 indicates the stock may have found support at the 23.6% Fibonacci retracement level, which often suggests potential resistance or support. |
Conclusion
The upward trend in EA stock from March to August 2025 indicates a strong bullish movement in response to market activities. As EA navigates its competitive landscape, the stock exhibited signs of resistance and support at calculated Fibonacci retracement levels. The price's current position near the 23.6% retracement suggests buyers maintain some influence, which can serve as support if buying pressure persists. Nevertheless, traders should remain cautious due to potential volatility influenced by broader market conditions and industry-specific developments. Continuous monitoring of retracement levels with market news can provide further insights for investors.
Smart Data Insight
Master the Perfect Entry & Exit for this Stock
Don't leave your profits to chance. Historically, this stock follows specific seasonal patterns that institutional traders use to maximize returns.
- ✅ Identify the "Golden Buying Window"
- ✅ Avoid high-risk correction cycles
- ✅ Backtested data from the last 20+ years