
June 06, 2026 a 03:30 am

EA: Dividend Analysis - Electronic Arts Inc.
Electronic Arts Inc., a prominent player in the gaming industry, exhibits a commendable dividend profile adorned by its steady growth trajectory in recent years. The company demonstrates fiscal diligence with a conservative payout strategy, ensuring a balance between rewarding shareholders and reinvesting in its thriving operations. This careful management has allowed the company to sustain and gradually elevate its dividend disbursements, signaling confidence in its future revenue streams.
📊 Overview
The following table outlines crucial metrics that inform our understanding of EA's dividend dynamics, serving as a lens through which we interpret its market commitments:
| Metric | Description |
|---|---|
| Sector | Video Games & Entertainment |
| Dividend Yield | 0.38% |
| Current Dividend per Share | $0.764 USD |
| Dividend History | 7 years |
| Last Cut or Suspension | None |
📈 Dividend History
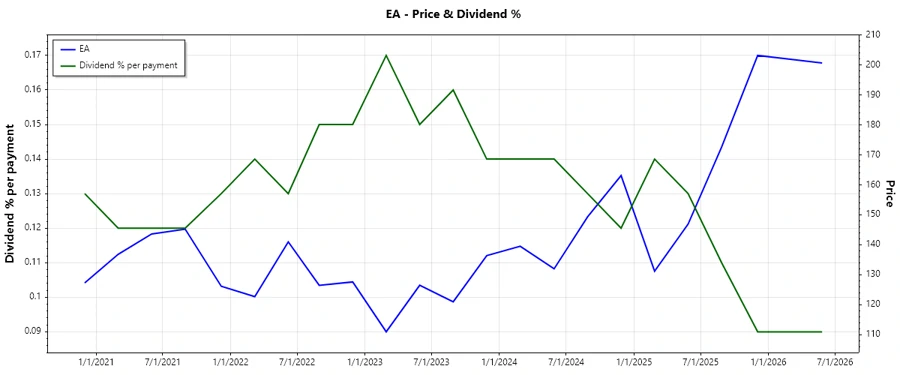
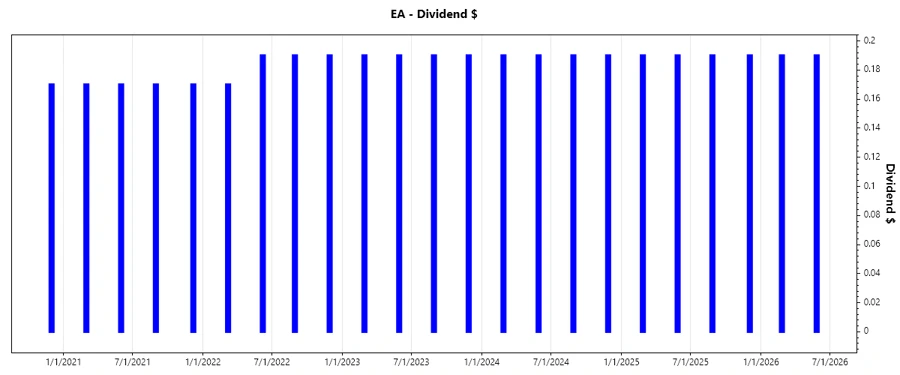
Over its 7-year dividend history, EA has consistently rewarded its shareholders, portraying a robust and reliable income stream from investments. This long-standing tradition of dividend payments enhances investor confidence, providing a sense of security amidst market volatility.
| Year | Dividend Per Share (USD) |
|---|---|
| 2026 | $0.38 |
| 2025 | $0.76 |
| 2024 | $0.76 |
| 2023 | $0.76 |
| 2022 | $0.74 |
📉 Dividend Growth
Evaluating EA’s dividend growth unveils a narrative of moderate acceleration over its payout history. Understanding the pace of dividend increase provides insights into the company’s potential for capital appreciation and its underlying earnings growth.
| Time | Growth |
|---|---|
| 3 years | 0.89% |
| 5 years | 34.91% |
The average dividend growth is 34.91% over 5 years. This shows moderate but steady dividend growth, indicating a potential for sustained earnings performance.
✅ Payout Ratio
Payout ratios are pivotal in assessing dividend sustainability, providing a glimpse into how much of its earnings EA allocates to shareholders, and how much remains for reinvestment.
| Type | Ratio |
|---|---|
| EPS-based | 21.53% |
| Free cash flow-based | 8.25% |
With a payout ratio of merely 21.53% (EPS) and 8.25% (FCF), EA exhibits a conservative dividend policy, offering ample room for strategic investments and growth while comfortably rewarding shareholders.
⚠️ Cashflow & Capital Efficiency
The efficiency of cash flow utilization underpins a company's operational prowess and its capacity to uphold robust dividend payouts in the face of economic challenges.
| Year | 2026 | 2025 | 2024 |
|---|---|---|---|
| Free Cash Flow Yield | 4.56% | 4.91% | 5.88% |
| Earnings Yield | 1.74% | 2.96% | 3.53% |
| CAPEX to Operating Cash Flow | 9.01% | 10.63% | 8.60% |
| Stock-based Compensation to Revenue | 8.71% | 8.60% | 7.72% |
| Free Cash Flow / Operating Cash Flow Ratio | 90.99% | 89.37% | 91.40% |
EA’s cash flow metrics reflect its adept capital allocation strategies, maintaining liquidity to cover dividends while reinvesting to fortify long-term profitability.
🗣️ Balance Sheet & Leverage Analysis
The strength of EA's balance sheet is mirrored in its leverage ratios, which delineate financial flexibility and resilience against debt obligations.
| Year | 2026 | 2025 | 2024 |
|---|---|---|---|
| Debt-to-Equity | 21.95% | 34.73% | 25.93% |
| Debt-to-Assets | 11.31% | 17.93% | 14.52% |
| Debt-to-Capital | 18.00% | 25.78% | 20.59% |
| Net Debt to EBITDA | -1.12 | 0.04 | -0.46 |
| Current Ratio | 1.05 | 0.95 | 1.37 |
| Quick Ratio | 1.05 | 0.95 | 1.37 |
| Financial Leverage | 1.94 | 1.94 | 1.79 |
EA’s leverage position is manageable, with sufficient liquidity indicated by its solid current and quick ratios, assuring capability to meet short-term liabilities without impairing operations.
🎯 Fundamental Strength & Profitability
Concentration on profitability margins and capital returns illuminates EA's vital area of strength, further justifying its dividend strategies.
| Year | 2026 | 2025 | 2024 |
|---|---|---|---|
| Return on Equity | 13.11% | 17.55% | 16.94% |
| Return on Assets | 6.76% | 9.06% | 9.49% |
| Net Margin | 11.78% | 15.02% | 16.83% |
| EBIT Margin | 15.43% | 22.28% | 21.78% |
| EBITDA Margin | 16.31% | 27.05% | 27.12% |
| Gross Margin | 78.97% | 79.32% | 77.39% |
| Research & Development to Revenue | 37.55% | 34.42% | 32.00% |
EA harnesses substantial profitability, evident in its ROE and margins, affirming its adeptness in delivering shareholder value through efficient asset utilization and reinvestment in innovation via R&D.
🔄 Price Development
📈 Dividend Scoring System
| Category | Rating | Score |
|---|---|---|
| Dividend Yield | 2 | |
| Dividend Stability | 4 | |
| Dividend Growth | 3 | |
| Payout Ratio | 5 | |
| Financial Stability | 4 | |
| Dividend Continuity | 3 | |
| Cashflow Coverage | 4 | |
| Balance Sheet Quality | 4 |
Total Score: 29/40
📝 Rating
In conclusion, Electronic Arts Inc. exhibits a robust dividend profile underscored by its prudent payout ratio and stable growth strategy. The company maintains financial stability and offers reassuring dividend continuity, countered slightly by a modest yield. Investors may consider EA a commendable option for dividend-focused portfolios with a moderate growth perspective.
Smart Data Insight
Master the Perfect Entry & Exit for this Stock
Don't leave your profits to chance. Historically, this stock follows specific seasonal patterns that institutional traders use to maximize returns.
- ✅ Identify the "Golden Buying Window"
- ✅ Avoid high-risk correction cycles
- ✅ Backtested data from the last 20+ years