May 09, 2026 a 12:46 pm


📊 EA: Dividend Analysis - Electronic Arts Inc.
Electronic Arts Inc., with its vast market reach in the gaming industry, showcases a developing dividend profile indicative of its maturity among tech-based companies. While the current dividend yield is modest, the increasing trajectory signals a steady commitment to shareholder returns. The limited history of payouts might concern some investors, yet the growth potential remains evident.
🗣️ Overview
Electronic Arts Inc., operating in the Consumer Discretionary sector, offers a modest dividend yield of 0.38%. The dividend per share currently stands at 0.764 USD, supported by a continuation of dividends over the past 7 years without recent cuts or suspensions.
| Category | Details |
|---|---|
| Sector | Consumer Discretionary |
| Dividend yield | 0.38% |
| Current dividend per share | 0.764 USD |
| Dividend history | 7 years |
| Last cut or suspension | None |
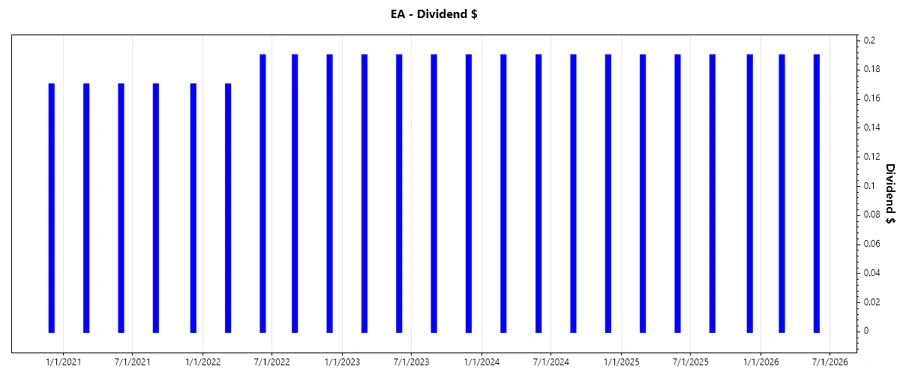
📉 Dividend History
The dividend history of EA reveals an increasing payment pattern over recent years. This consistency might indicate the firm’s ability to sustain its dividend scheme benefitting shareholders. Such a pattern is crucial as it reflects on the company’s commitment to returning value to its investors.
| Year | Dividend per Share (USD) |
|---|---|
| 2026 | 0.38 |
| 2025 | 0.76 |
| 2024 | 0.76 |
| 2023 | 0.76 |
| 2022 | 0.74 |
📈 Dividend Growth
Electronic Arts Inc. has demonstrated a steady upward trend in its dividend payments over the years. The dividend growth rate over 3 years stands at approximately 0.89%, while over 5 years, it reflects a growth of about 35%. This indicates a stable growth for long-term investors.
| Time | Growth |
|---|---|
| 3 years | 0.89% |
| 5 years | 34.92% |
The average dividend growth is 34.92% over 5 years. This shows moderate but steady dividend growth.
✅ Payout Ratio
The payout ratio serves as a key indicator of dividend sustainability. A payout ratio based on EPS of 21.53% and a relatively low free cash flow-based payout ratio of 8.23% highlight EA's substantial coverage and room for potential future dividend increases.
| Key figure | Ratio |
|---|---|
| EPS-based | 21.53% |
| Free cash flow-based | 8.23% |
Such figures illustrate a strong ability to maintain and potentially increase dividends without putting financial strain on the company’s operations.
💰 Cashflow & Capital Efficiency
Analyzing EA's cash flow metrics sheds light on capital efficiency and cash generation capabilities. Maintaining high free cash flow and efficient capital allocation emphasizes the company's operational robustness.
| Metric | 2026 | 2025 | 2024 |
|---|---|---|---|
| Free Cash Flow Yield | 4.56% | 4.91% | 5.88% |
| Earnings Yield | 1.74% | 2.96% | 3.54% |
| CAPEX to Operating Cash Flow | 9.01% | 10.63% | 8.60% |
| Stock-based Compensation to Revenue | 8.71% | 8.60% | 7.72% |
| Free Cash Flow / Operating Cash Flow Ratio | 90.99% | 89.37% | 91.40% |
The stability in cash flow rates alongside a sound capital efficiency strategy makes EA a strong candidate for continued investment potential.
🔍 Balance Sheet & Leverage Analysis
Understanding EA's balance sheet strength and leverage ratios is crucial for evaluating its financial stability and risk profile. Debt management plays a critical role in assessing long-term viability.
| Metric | 2026 | 2025 | 2024 |
|---|---|---|---|
| Debt-to-Equity | 0.22 | 0.35 | 0.26 |
| Debt-to-Assets | 0.11 | 0.18 | 0.15 |
| Debt-to-Capital | 0.18 | 0.26 | 0.21 |
| Net Debt to EBITDA | -1.12 | 0.04 | -0.46 |
| Current Ratio | 1.05 | 0.95 | 1.37 |
| Quick Ratio | 1.05 | 0.95 | 1.37 |
| Financial Leverage | 1.94 | 1.94 | 1.79 |
EA's prudent leverage management with favorable debt-to-equity and quick ratios suggest a solid capacity to uphold its financial obligations.
📈 Fundamental Strength & Profitability
Profitability and fundamental strength provide insights into a company's efficiency and operational success. High returns on equity enhance investor trust and entice greater investment.
| Metric | 2026 | 2025 | 2024 |
|---|---|---|---|
| Return on Equity | 13.11% | 17.55% | 16.94% |
| Return on Assets | 6.75% | 9.06% | 9.49% |
| Net Margin | 11.78% | 15.02% | 16.83% |
| EBIT Margin | 15.43% | 22.28% | 21.78% |
| EBITDA Margin | 16.31% | 27.05% | 27.12% |
| Gross Margin | 78.97% | 79.32% | 77.39% |
| R&D to Revenue | 37.55% | 34.42% | 32.00% |
The attractive margins and positive fundamental strengths underscore EA's competence in delivering value while driving consistent profitability.
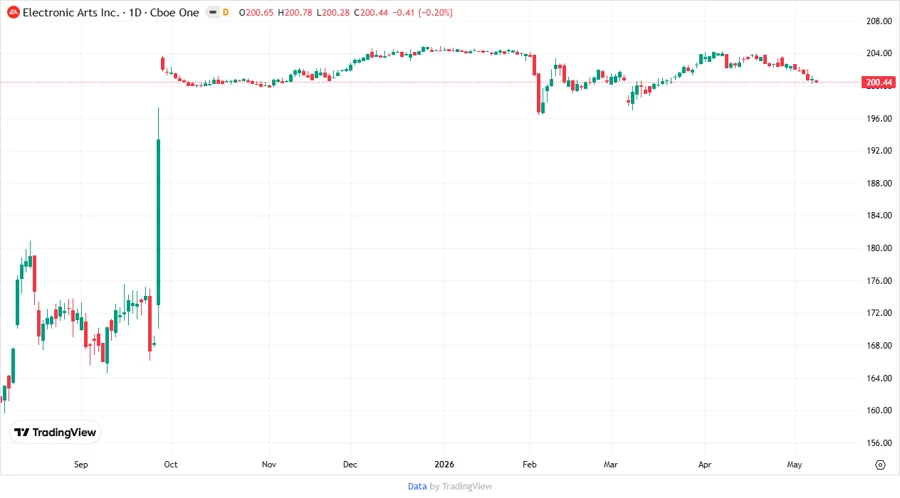
📈 Price Development
✅ Dividend Scoring System
| Category | Score | Score Bar |
|---|---|---|
| Dividend yield | 3 | |
| Dividend Stability | 4 | |
| Dividend growth | 4 | |
| Payout ratio | 5 | |
| Financial stability | 4 | |
| Dividend continuity | 4 | |
| Cashflow Coverage | 5 | |
| Balance Sheet Quality | 4 |
🟢 Total Score: 33/40
🔖 Rating
Electronic Arts Inc. demonstrates a commendable blend of dividend payment consistency and potential for dividend growth. Despite a lower current yield, the organization's financial stability and robust cash flows suggest a strong capacity for maintaining and potentially enhancing dividend payouts. Investors seeking exposure to a diversified portfolio with substantial growth opportunities may find EA an appealing choice. The overall recommendation is a solid buy for investors focusing on long-term growth and steady income prospects.
Smart Data Insight
Master the Perfect Entry & Exit for this Stock
Don't leave your profits to chance. Historically, this stock follows specific seasonal patterns that institutional traders use to maximize returns.
- ✅ Identify the "Golden Buying Window"
- ✅ Avoid high-risk correction cycles
- ✅ Backtested data from the last 20+ years