March 03, 2026 a 02:46 am

EA: Dividend Analysis - Electronic Arts Inc.
Electronic Arts Inc. (EA) presents an intriguing opportunity for dividend-focused investors. The company has maintained a modest dividend yield, complemented by a respectable history of payouts. Despite various market challenges, EA has demonstrated commitment to shareholder returns through consistent dividend distributions. Assessing the underlying financial health and strategic management decisions will aid in understanding EA's potential as a reliable dividend payer. Below is a comprehensive analysis of EA's dividend performance and fundamental metrics.
Overview 📊
Electronic Arts Inc., a notable player in the entertainment sector, offers valuable insights into its dividend framework. Rooted in a dynamic industry, EA has achieved a balance between growth investments and shareholder returns.
| Metric | Details |
|---|---|
| Sector | Entertainment |
| Dividend Yield | 0.38% |
| Current Dividend Per Share | 0.76 USD |
| Dividend History | 7 years |
| Last Cut or Suspension | None |
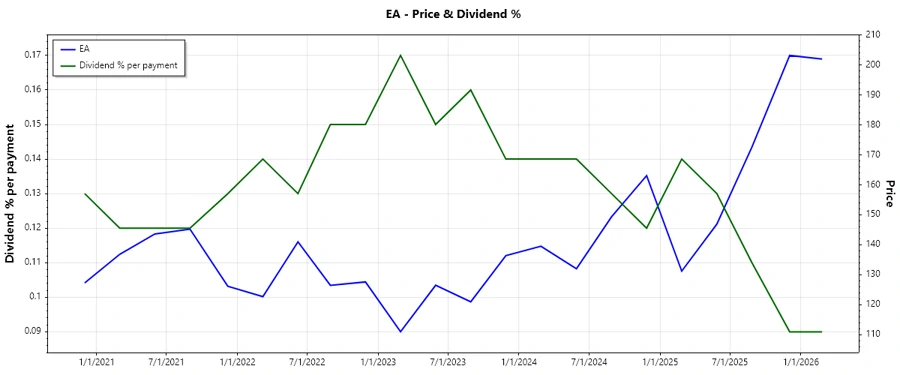
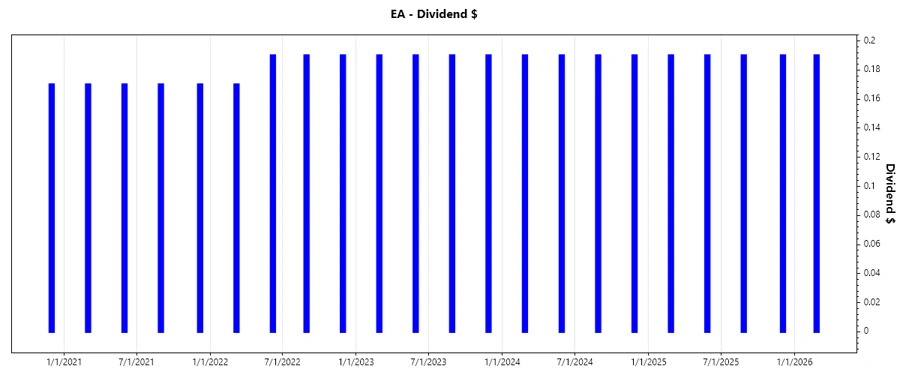
Dividend History 📈
Consistent dividend payments cultivate shareholder trust and signify stable cash flows. EA's seven-year history without cuts highlights its fiscal discipline.
| Year | Dividend Per Share |
|---|---|
| 2026 | 0.19 USD |
| 2025 | 0.76 USD |
| 2024 | 0.76 USD |
| 2023 | 0.76 USD |
| 2022 | 0.74 USD |
Dividend Growth 🗣️
The trajectory of EA's dividend growth suggests a commitment to increasing shareholder payouts. This metric is crucial for evaluating future dividend potential and income compounding benefits.
| Time | Growth |
|---|---|
| 3 years | 0.89% |
| 5 years | 34.92% |
The average dividend growth is 34.92% over 5 years. This shows moderate but steady dividend growth.
Payout Ratio ✅
EA's payout ratios, calculated from EPS and free cash flow, indicate sustainable dividend payments. Such ratios suggest a prudent dividend policy aligned with earnings and cash flow realities.
| Key Figure | Ratio |
|---|---|
| EPS-based | 27.92% |
| Free Cash Flow-based | 8.27% |
The EPS-based payout ratio of 27.92% alongside the FCF-based ratio of 8.27% demonstrates EA's disciplined approach to maintaining dividend affordability and growth potential.
Cashflow & Capital Efficiency 📉
Analyzing cash flow and capital efficiency provides insights into EA’s ability to fund dividends without compromising business growth. Ratios such as free cash flow yield and stock-based compensation to revenue offer a closer look at financial health.
| Metric | 2023 | 2024 | 2025 |
|---|---|---|---|
| Free Cash Flow Yield | 4.03% | 5.88% | 4.91% |
| Earnings Yield | 2.40% | 3.54% | 2.96% |
| CAPEX to Operating Cash Flow | 13.35% | 8.60% | 10.63% |
| Stock-based Compensation to Revenue | 7.38% | 7.72% | 8.60% |
| Free Cash Flow / Operating Cash Flow Ratio | 86.65% | 91.40% | 89.37% |
EA's solid cash flow coverage and efficient capital allocation strategies highlight robust underwriting of its dividends and operational flexibility.
Balance Sheet & Leverage Analysis ⚠️
A thorough review of EA’s balance sheet metrics aids in understanding its leverage, liquidity, and overall financial health. Ratios such as debt-to-equity and current ratio serve as important indicators.
| Metric | 2023 | 2024 | 2025 |
|---|---|---|---|
| Debt-to-Equity | 0.27 | 0.26 | 0.35 |
| Debt-to-Assets | 0.14 | 0.15 | 0.18 |
| Debt-to-Capital | 0.21 | 0.21 | 0.26 |
| Net Debt to EBITDA | -0.25 | -0.46 | 0.04 |
| Current Ratio | 1.21 | 1.37 | 0.95 |
| Quick Ratio | 1.21 | 1.37 | 0.95 |
| Financial Leverage | 1.85 | 1.79 | 1.94 |
EA maintains a commendable leverage profile with sufficient liquidity to meet obligations, affirming its capacity for sustainable dividend issuance.
Fundamental Strength & Profitability 🗣️
Examining profitability ratios like ROE and net margins provides a deeper understanding of EA's efficiency in generating returns and overall financial vigor.
| Metric | 2023 | 2024 | 2025 |
|---|---|---|---|
| Return on Equity | 11% | 17% | 18% |
| Return on Assets | 6% | 9% | 9% |
| Margins: Net | 10.80% | 16.83% | 15.02% |
| EBIT | 18.64% | 21.78% | 22.28% |
| EBITDA | 25.86% | 27.12% | 27.05% |
| Gross | 75.87% | 77.39% | 79.32% |
| Research & Development to Revenue | 31.35% | 32.00% | 34.42% |
The high ROE and robust profit margins indicate EA’s strength in maximizing shareholder value, positioning it as a strong candidate for long-term investment.
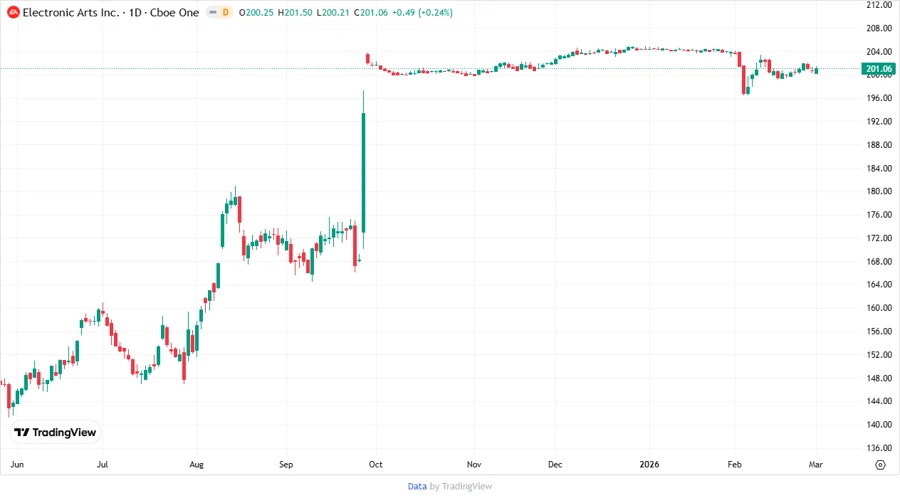
Price Development 📈
Dividend Scoring System ✅
| Criteria | Score | Visual Indicator |
|---|---|---|
| Dividend Yield | 2 | |
| Dividend Stability | 4 | |
| Dividend Growth | 3 | |
| Payout Ratio | 5 | |
| Financial Stability | 4 | |
| Dividend Continuity | 5 | |
| Cashflow Coverage | 4 | |
| Balance Sheet Quality | 5 |
Total Score: 32/40
Rating 🔍
Electronic Arts Inc. is rated as a solid dividend-paying stock, offering consistency and financial robustness. The firm exhibits a compelling balance between dividend payouts and growth potential, making it a suitable choice for long-term dividend investors seeking both stability and strategic growth opportunities.
Smart Data Insight
Master the Perfect Entry & Exit for this Stock
Don't leave your profits to chance. Historically, this stock follows specific seasonal patterns that institutional traders use to maximize returns.
- ✅ Identify the "Golden Buying Window"
- ✅ Avoid high-risk correction cycles
- ✅ Backtested data from the last 20+ years