August 15, 2025 a 08:15 am

D: Trend and Support & Resistance Analysis - Dominion Energy, Inc.
Dominion Energy, Inc. operates within a diverse energy market in the United States. Its operations cover electricity and natural gas sectors, serving millions of customers across multiple states. This analysis reviews recent market trends and identifies key support and resistance levels, providing insights into the stock's potential direction in upcoming trading sessions.
Trend Analysis
| Date | Close Price | Trend |
|---|---|---|
| 2025-08-14 | 61.18 | ▲ |
| 2025-08-13 | 62.10 | ▲ |
| 2025-08-12 | 61.31 | ▲ |
| 2025-08-11 | 61.49 | ▲ |
| 2025-08-08 | 61.81 | ▲ |
| 2025-08-07 | 61.74 | ▲ |
| 2025-08-06 | 60.97 | ▲ |
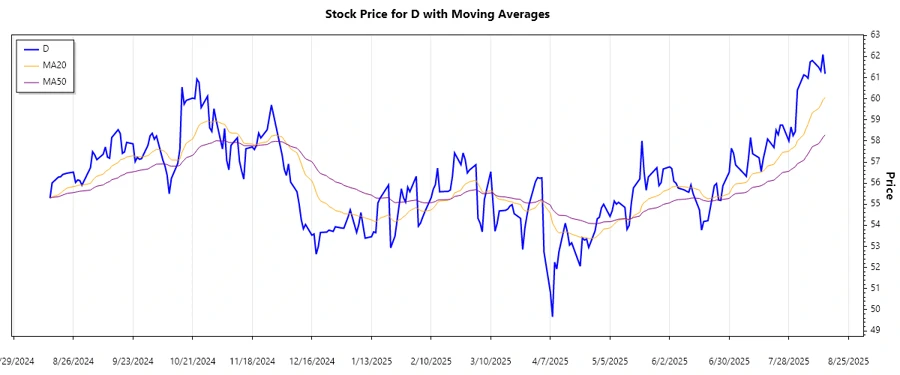
The recent trends suggest an ongoing upward momentum as indicated by the closing prices and market sentiment. The stock exhibits an ▲ Uptrend, driven by improved investor confidence and potential market catalysts.
Support- and Resistance
| Zone Type | From | To | |
|---|---|---|---|
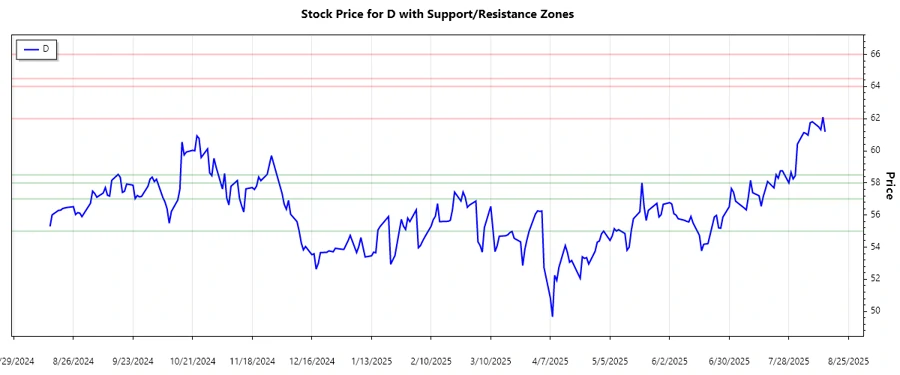
| Support 1 | 55.00 | 57.00 | » |
| Support 2 | 58.00 | 58.50 | » |
| Resistance 1 | 62.00 | 64.00 | « |
| Resistance 2 | 64.50 | 66.00 | « |
The current price is nearing the upper boundary of a resistance zone, which could challenge further price gains unless broken.
Conclusion
The analysis of Dominion Energy's stock reflects a positive trend, where the stock has shown resilience with sustained upward momentum. Prices are approaching resistance zones that might temper short-term gains. Strong support levels below provide a buffer against significant dips, while breaking above resistance could signal further upward movement. Investors should consider both macroeconomic factors and sector-specific catalysts, alongside these technical insights when forming investment decisions.
Smart Data Insight
Master the Perfect Entry & Exit for this Stock
Don't leave your profits to chance. Historically, this stock follows specific seasonal patterns that institutional traders use to maximize returns.
- ✅ Identify the "Golden Buying Window"
- ✅ Avoid high-risk correction cycles
- ✅ Backtested data from the last 20+ years