
July 13, 2026 a 03:15 pm
D: Fibonacci Analysis - Dominion Energy, Inc.
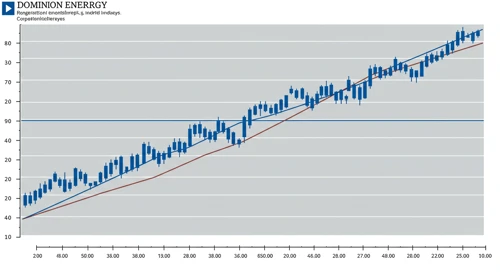
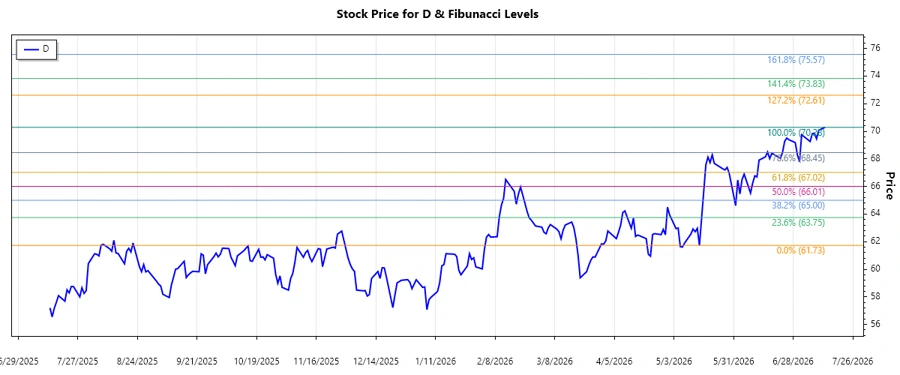
The stock of Dominion Energy, Inc. (Ticker: D) has been experiencing an upward trend over the analyzed period. With its strong position in energy distribution and production, the company shows potential for robust growth. The current trend indicates positive sentiment among investors, and technical analysis hints at forthcoming resistance zones that might challenge this momentum. It is essential to watch for potential retracements that could provide new support levels.
Fibonacci Analysis
| Parameter | Details |
|---|---|
| Trend Start Date | 2026-05-15 |
| Trend End Date | 2026-07-13 |
| High Point | $70.285 on 2026-07-13 |
| Low Point | $61.73 on 2026-05-15 |
| Fibonacci Levels |
|
| Current Price | $70.285 |
| Retracement Zone | None |
| Interpretation | The current stock price is above the highest Fibonacci level, suggesting a continuation of the bullish trend with no immediate retracement predicted. The stock could continue testing new resistance levels, with no current support seen within the Fibonacci retracement zones. |
Conclusion
The recent uptrend in Dominion Energy, Inc.'s stock aligns well with broader market optimism in the energy sector. While the stock price currently exceeds Fibonacci retracement levels, the outlook remains positive unless market conditions induce broader corrections. Investors should apply caution as overbought conditions may attract profit-taking in the short term. Long-term prospects are supported by Dominion's robust infrastructure and diversified operations, but upcoming challenges include regulatory risks and energy market volatility.
Smart Data Insight
Master the Perfect Entry & Exit for this Stock
Don't leave your profits to chance. Historically, this stock follows specific seasonal patterns that institutional traders use to maximize returns.
- ✅ Identify the "Golden Buying Window"
- ✅ Avoid high-risk correction cycles
- ✅ Backtested data from the last 20+ years