May 13, 2026 a 12:47 pm


📊 Dividend Analysis - Dominion Energy, Inc.
Dominion Energy, Inc. is a significant player in the energy sector with a noteworthy history of providing dividends. With a strong market capitalization and a sustained dividend history, it represents a potentially stable income source for investors. However, its recent dividend growth trajectory and payout ratios might raise concerns about future yields and capital efficiency. Overall, Dominion's financial strategy should be keenly analyzed to determine its alignment with investor expectations for income generation.
🗣️ Overview
Dominion Energy, Inc. operates in the utility sector, providing essential services with a long history of dividends to its shareholders. A comprehensive analysis of the company's dividend metrics is imperative to understand its standing in the market and future prospects.
| Key Metrics | Details |
|---|---|
| Sector | Utilities |
| Dividend Yield | 4.24% |
| Current Dividend Per Share | $2.67 USD |
| Dividend History | 43 years |
| Last Cut or Suspension | None |
📈 Dividend History
Dominion Energy has been consistent in paying dividends over the years. This longevity provides reassurance of the company's ability to generate sufficient cash flows to reward shareholders. The analysis of its recent payouts can offer insights into its commitment to investor returns.
| Year | Dividend Per Share (USD) |
|---|---|
| 2026 | 1.3350 |
| 2025 | 2.6700 |
| 2024 | 2.6700 |
| 2023 | 2.6700 |
| 2022 | 2.6700 |
📉 Dividend Growth
Understanding the trajectory of Dominion's dividend growth is critical. Although recent trends show stagnation, historical growth over five years, despite being minimal, still indicates a commitment to sustaining payouts. Investors must weigh this growth rate against market expectations.
| Time | Growth |
|---|---|
| 3 years | 0% |
| 5 years | -4.996% |
The average dividend growth is -4.996% over 5 years. This indicates a decline which brings attention to the need for analysis of Dominion's financial resilience and strategic planning in dividend management.
✅ Payout Ratio
The payout ratio reflects Dominion's ability to maintain dividend payments with respect to its earnings and cash flow. Higher ratios can indicate less room for maneuver, potentially impacting future dividend stability.
| Key Figure | Ratio |
|---|---|
| EPS-based | 78.85% |
| Free cash flow-based | -31.71% |
The EPS payout ratio of 78.85% signifies a high distribution of earnings towards dividend payments, which might concern investors about sustaining such practices, especially considering the negative FCF payout ratio of -31.71%.
🖋️ Cashflow & Capital Efficiency
Capital efficiency and cash flow stability are foundational to sustaining operations and supporting dividends. Analyses of related metrics highlight potential areas of strength or concern.
| Metric | 2023 | 2024 | 2025 |
|---|---|---|---|
| Free Cash Flow Yield | -0.097% | -0.164% | -0.145% |
| Earnings Yield | 5.38% | 4.70% | 6.00% |
| CAPEX to Operating Cash Flow | 1.56 | 2.48 | 2.36 |
| Stock-based Compensation to Revenue | 0% | 0% | 0% |
| Free Cash Flow / Operating Cash Flow Ratio | -0.56 | -1.48 | -1.36 |
The volatility in cash flow ratios shows potential inefficiencies in capital use requiring strategic adjustments for improving financial health and dividend assurance.
🧾 Balance Sheet & Leverage Analysis
Balance sheet strength and effective leverage management are critical for long-term sustainability. Analyzing these factors helps gauge financial risk exposure, especially regarding existing obligations.
| Metric | 2023 | 2024 | 2025 |
|---|---|---|---|
| Debt-to-Equity | 1.61 | 1.53 | 1.68 |
| Debt-to-Assets | 0.41 | 0.41 | 0.42 |
| Debt-to-Capital | 0.62 | 0.61 | 0.63 |
| Net Debt to EBITDA | 5.85 | 6.18 | 6.07 |
| Current Ratio | 1.04 | 0.71 | 0.77 |
| Quick Ratio | 0.97 | 0.52 | 0.59 |
| Financial Leverage | 3.96 | 3.76 | 3.98 |
Dominion's debt levels suggest significant leverage which may impact future investment flexibility, demanding prudent management to maintain financial stability.
💡 Fundamental Strength & Profitability
Profitability metrics like ROE and RA combined with margin analysis reveal the operational capability of the company to generate returns and sustain competitive positioning.
| Metric | 2023 | 2024 | 2025 |
|---|---|---|---|
| Return on Equity | 7.38% | 7.79% | 10.31% |
| Return on Assets | 1.86% | 2.07% | 2.59% |
| Net Margin | 14.11% | 14.69% | 18.16% |
| EBIT Margin | 30.56% | 28.14% | 34.13% |
| EBITDA Margin | 52.29% | 46.39% | 48.59% |
| Gross Margin | 48.34% | 47.87% | 49.02% |
Dominion's fundamental strength is depicted through consistent profitability despite facing market challenges, warranting investor attention with regards to future profitability sustainability.
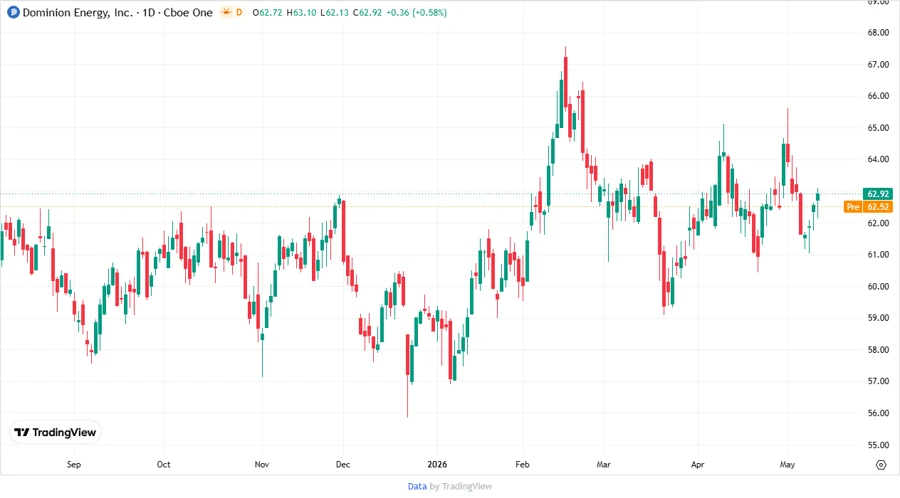
🌟 Price Development
🎯 Dividend Scoring System
| Factor | Score | Visual Representation |
|---|---|---|
| Dividend Yield | 4 | |
| Dividend Stability | 4 | |
| Dividend Growth | 2 | |
| Payout Ratio | 3 | |
| Financial Stability | 3 | |
| Dividend Continuity | 5 | |
| Cashflow Coverage | 2 | |
| Balance Sheet Quality | 3 |
Total Score: 26/40
🏆 Rating
Dominion Energy's dividend profile is robust in terms of yield and continuity but lacks in growth and cashflow efficiency. Prospective investors might consider the current high leverage and low growth as cautionary factors, even as the stability of dividend payments remains a considerable upside. Strategic improvements in managing capital expenditures and leveraging could positively influence future income streams.
Smart Data Insight
Master the Perfect Entry & Exit for this Stock
Don't leave your profits to chance. Historically, this stock follows specific seasonal patterns that institutional traders use to maximize returns.
- ✅ Identify the "Golden Buying Window"
- ✅ Avoid high-risk correction cycles
- ✅ Backtested data from the last 20+ years