March 11, 2026 a 03:31 am
📊 Dividend Analysis - Dominion Energy, Inc.
Dominion Energy, Inc. (ticker: D) presents itself as a robust investment choice in the utilities sector. Its substantial market capitalization and consistent dividend history highlight its credibility. However, potential investors should consider the stagnant dividend growth and assess its capacity for future increases. The company's financial ratios indicate stability but also suggest areas that might require attention.
✅ Overview
Dominion Energy operates within the utilities sector and offers an attractive dividend yield of 4.23%. Currently, it provides a dividend per share of 2.67 USD. The dividend history stretches over 43 years, attesting to its reliability, with no recent cuts or suspensions documented.
| Metric | Value |
|---|---|
| Sector | Utilities |
| Dividend Yield | 4.23% |
| Current Dividend per Share | 2.67 USD |
| Dividend History | 43 years |
| Last Cut or Suspension | None |
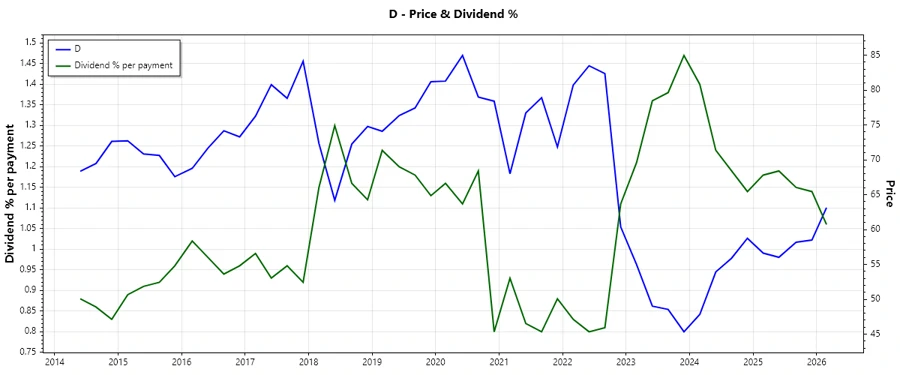
📈 Dividend History
The lengthy dividend history of Dominion Energy demonstrates its commitment to return capital to shareholders, making it a dependable choice for income-focused investors. A thorough examination of historical trends is crucial to anticipate potential risks and benefits.
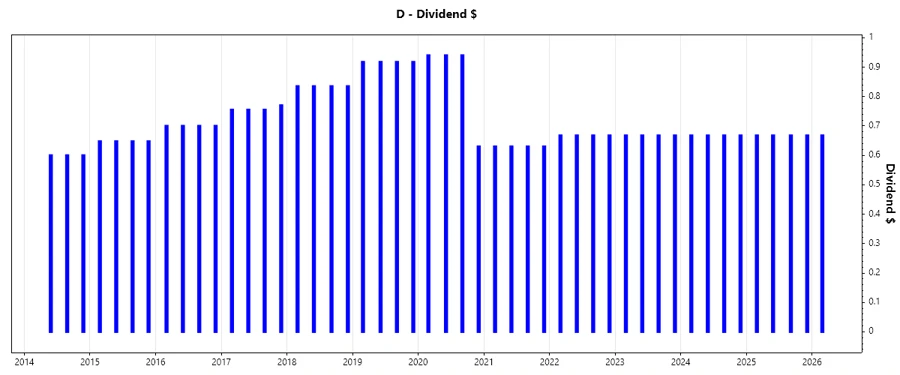
| Year | Dividend per Share (USD) |
|---|---|
| 2026 | 0.67 |
| 2025 | 2.67 |
| 2024 | 2.67 |
| 2023 | 2.67 |
| 2022 | 2.67 |
📈 Dividend Growth
Dividend growth is a vital indicator of a company’s capacity to enhance shareholder returns. The analysis of Dominion Energy's growth rates provides insight into its future potential and financial health.
| Time | Growth |
|---|---|
| 3 years | 0% |
| 5 years | -5.00% |
The average dividend growth is -5.00% over 5 years. This indicates a need for caution due to a decline in dividend payouts, suggesting potential underlying financial challenges.
📉 Payout Ratio
An evaluation of the payout ratio is essential to understand if the dividends are sustainable. A high payout ratio can indicate limited room for dividend increases or potential cuts.
| Key Figure | Ratio |
|---|---|
| EPS-based | 76.00% |
| Free Cash Flow-based | -32.20% |
The EPS-based payout ratio of 76% is moderately high, possibly limiting future dividend hikes. The negative Free Cash Flow-based ratio requires attention as it indicates challenges in generating sufficient cash flow to sustain dividends, emphasizing potential risks.
🔍 Cashflow & Capital Efficiency
An analysis of cashflows and capital efficiency is vital to ensure sustained operational performance and the ability to fund dividends and growth initiatives.
| Metric | 2023 | 2024 | 2025 |
|---|---|---|---|
| Free Cash Flow Yield | -13.21% | -16.39% | -14.55% |
| Earnings Yield | 5.38% | 4.70% | 5.99% |
| CAPEX to Operating Cash Flow | 1.56 | 2.48 | 2.36 |
| Stock-based Compensation to Revenue | 0 | 0 | 0 |
| Free Cash Flow / Operating Cash Flow Ratio | -0.56 | -1.48 | -1.36 |
Dominion Energy’s negative Free Cash Flow Yield and Free Cash Flow / Operating Cash Flow Ratio necessitate careful monitoring of its cash management strategies to maintain capital efficiency.
🔍 Balance Sheet & Leverage Analysis
Analyzing balance sheet strength and leverage levels allows for the assessment of financial resilience and risk management.
| Metric | 2023 | 2024 | 2025 |
|---|---|---|---|
| Debt-to-Equity | 1.61 | 1.53 | 1.68 |
| Debt-to-Assets | 0.41 | 0.41 | 0.42 |
| Debt-to-Capital | 0.62 | 0.61 | 0.63 |
| Net Debt to EBITDA | 5.85 | 6.18 | 6.27 |
| Current Ratio | 0.97 | 0.52 | 0.59 |
| Quick Ratio | 0.77 | 0.71 | 0.77 |
| Financial Leverage | 3.76 | 3.98 | 3.76 |
The leverage indicators, particularly the Net Debt to EBITDA ratio, suggest an elevated debt level relative to earnings, requiring close attention to the company's debt servicing capabilities.
🔍 Fundamental Strength & Profitability
Assessing fundamental strength and profitability is critical to understanding the company’s core operational performance and potential for future earnings.
| Metric | 2023 | 2024 | 2025 |
|---|---|---|---|
| Return on Equity | 10.31% | 7.79% | 7.38% |
| Return on Assets | 2.59% | 2.07% | 1.86% |
| Margins: Net | 18.16% | 14.69% | 14.11% |
| Margins: EBIT | 34.13% | 28.14% | 30.56% |
| Margins: Gross | 49.02% | 47.87% | 48.34% |
| Research & Development to Revenue | 0 | 0 | 0 |
Dominion Energy exhibits solid gross margins and a respectable Return on Equity, affirming its capacity to generate shareholder value, though attention to asset utilization is warranted.
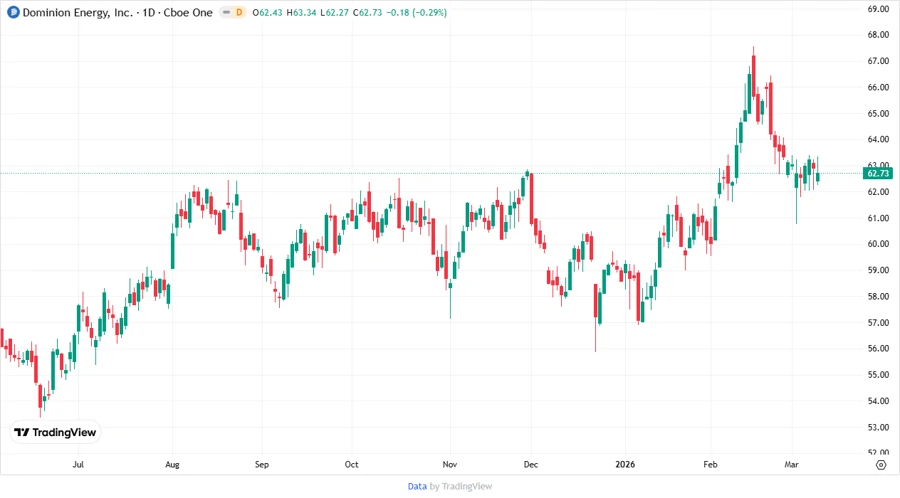
📉 Price Development
🏆 Dividend Scoring System
| Criteria | Score (1-5) | Score Bar |
|---|---|---|
| Dividend yield | 4 | |
| Dividend Stability | 5 | |
| Dividend growth | 2 | |
| Payout ratio | 3 | |
| Financial stability | 3 | |
| Dividend continuity | 5 | |
| Cashflow Coverage | 2 | |
| Balance Sheet Quality | 3 |
Total Score: 27/40
🗣️ Rating
Dominion Energy, Inc. solidifies its position as a reputable name in dividend investing, primarily due to its dividend history and yield. However, cautious optimism is advised due to stagnant growth and financial ratios that may limit future expansion. Investors should maintain a balanced perspective, weighing the yield against potential risks.