February 14, 2026 a 03:31 pm


📊 Dividend Analysis - Dominion Energy, Inc.
Dominion Energy, Inc. stands as a notable example in the utilities sector with its substantial track record of dividend payments. However, recent shifts in its financial posture have sparked cautious analysis. Investors eye its high dividend yield with interest, although its payout ratios suggest heightened scrutiny is warranted. The company’s long-standing history of distributions reflects stability, yet evolving economic conditions have led to nuanced dividend dynamics.
🗣️ Overview
Dominion Energy is a key player in the utilities sector, providing a stable yet slightly fluctuating dividend yield of 4.01%. The current dividend per share is $2.67 with a remarkable 43-year history of steady payouts, although the recent years have not seen significant growth.
| Attribute | Detail |
|---|---|
| Sector | Utilities |
| Dividend yield | 4.01% |
| Current dividend per share | 2.67 USD |
| Dividend history | 43 years |
| Last cut or suspension | None |
📈 Dividend History
Dominion Energy’s dividend history reflects a notable 43-year continuance. Stability in dividends is critical for investor confidence and reflects the company's ongoing positive cash flow despite market challenges.
| Year | Dividend per Share (USD) |
|---|---|
| 2026 | 0.6675 |
| 2025 | 2.6700 |
| 2024 | 2.6700 |
| 2023 | 2.6700 |
| 2022 | 2.6700 |
📉 Dividend Growth
Analyzing the dividend growth is imperative to understand the future potential of income from dividends. Dominion Energy has reported no growth in the last three years, and a negative growth over five years suggests a reevaluation might be necessary for dividend growth strategies.
| Time | Growth |
|---|---|
| 3 years | 0% |
| 5 years | -5% |
The average dividend growth is -5% over 5 years. This shows moderate but steady dividend decline, suggesting potential challenges in sustaining dividend payouts.
✅ Payout Ratio
The payout ratios provide insight into how much of the company's earnings and free cash flow are dedicated to dividend payments, which is crucial for evaluating financial health.
| Key figure | Ratio |
|---|---|
| EPS-based | 97.33% |
| Free cash flow-based | -29.41% |
The payout ratios indicate an EPS-based payout of nearly 97.33%, which is high and suggests a limited buffer for dividend flexibility. The negative FCF payout ratio highlights potential cash flow issues, necessitating closer examination.
⚠️ Cashflow & Capital Efficiency
Evaluating cash flow dynamics unveils the robustness of a company's financial operations and its capital allocation efficiency, which are essential for sustaining dividends.
| Metric | 2024 | 2023 | 2022 |
|---|---|---|---|
| Free Cash Flow Yield | -16.39% | -9.69% | -8.03% |
| Earnings Yield | 4.70% | 5.28% | 2.61% |
| CAPEX to Operating Cash Flow | 2.54 | 1.56 | 2.10 |
| Stock-based Compensation to Revenue | 0% | 0% | 0% |
| Free Cash Flow / Operating Cash Flow Ratio | -147.65% | -55.74% | -109.68% |
The cash flow figures describe a situation where Dominion Energy struggles with free cash flow sufficiency amidst high capital expenditure costs, which could strain future dividend payouts.
⚠️ Balance Sheet & Leverage Analysis
Understanding leverage ratios and balance sheet strength helps in assessing financial stability and potential risks due to debt obligations.
| Metric | 2024 | 2023 | 2022 |
|---|---|---|---|
| Debt-to-Equity | 1.53 | 1.61 | 1.49 |
| Debt-to-Assets | 0.41 | 0.41 | 0.39 |
| Debt-to-Capital | 0.61 | 0.62 | 0.60 |
| Net Debt to EBITDA | 6.18 | 6.46 | 6.45 |
| Current Ratio | 0.84 | 1.04 | 0.73 |
| Quick Ratio | 0.52 | 0.97 | 0.62 |
| Financial Leverage | 3.76 | 3.96 | 3.79 |
The high debt ratios point towards significant leverage which could potentially impact financial flexibility and raise concerns regarding the company's ability to withstand economic downturns.
⚠️ Fundamental Strength & Profitability
Reviewing profitability metrics alongside return on equity and assets provides an overarching view of the company’s ability to generate profits from its operations.
| Metric | 2024 | 2023 | 2022 |
|---|---|---|---|
| Return on Equity | 7.79% | 7.24% | 4.78% |
| Return on Assets | 2.07% | 1.83% | 1.26% |
| Net Margin | 14.70% | 13.85% | 9.48% |
| EBIT Margin | 28.14% | 25.67% | 23.39% |
| EBITDA Margin | 46.39% | 47.40% | 45.72% |
| Gross Margin | 47.87% | 48.34% | 45.75% |
| Research & Development to Revenue | 0% | 0% | 0% |
While the profitability metrics show positive trends, indicating effective cost control and revenue generation, low R&D expenditures could suggest a lack of strategic investment in future growth.
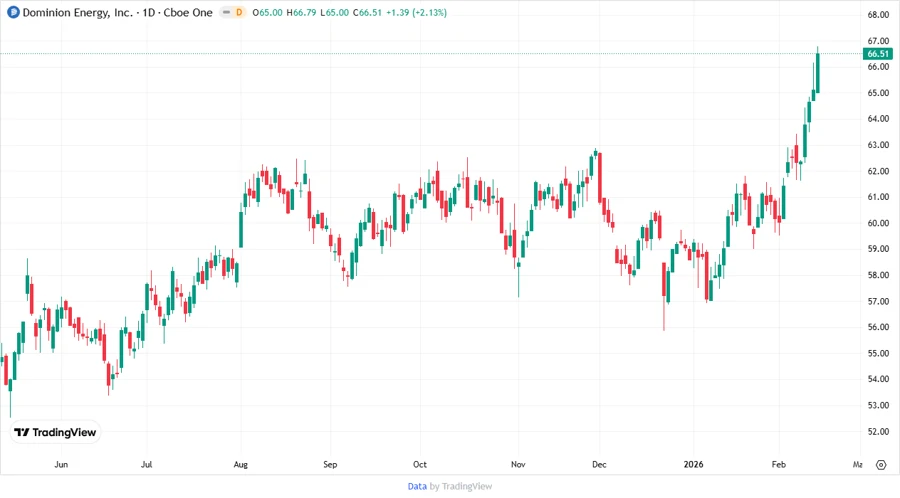
📈 Price Development
The following chart provides insights into the price development of Dominion Energy’s stock, showcasing the market's response to its financial strategies.
✅ Dividend Scoring System
| Category | Score | Assessment |
|---|---|---|
| Dividend yield | 4 | |
| Dividend Stability | 4 | |
| Dividend growth | 1 | |
| Payout ratio | 2 | |
| Financial stability | 2 | |
| Dividend continuity | 5 | |
| Cashflow Coverage | 1 | |
| Balance Sheet Quality | 2 |
Total Score: 21/40
Rating
Dominion Energy receives a cautious rating due to its high dividend yield and impressive dividend history being overshadowed by concerns surrounding its payout ratios and leverage metrics. Investors are advised to closely monitor potential financial adjustments and strategic initiatives aimed at strengthening cash flow sustainability.