January 30, 2026 a 07:31 am


D: Dividend Analysis - Dominion Energy, Inc.
Dominion Energy, Inc. presents an intriguing profile for dividend investors with a long history of steady dividend payments, spanning 43 years. However, recent shifts in the growth rate, along with payout ratios that require close monitoring, suggest careful consideration is warranted. Investors should weigh the benefits of the current yield in relation to the company's financial strategy and capital management. As the energy landscape evolves, Dominion's ability to maintain its dividend commitment while navigating industry challenges remains a key consideration.
Overview
Dominion Energy, Inc. has established itself as a consistent player in the utilities sector. The company's current dividend yield of 4.39% is an attractive incentive for income-seeking investors. Dominion's commitment to shareholder value is evidenced by its 43-year dividend history. However, attention must be paid to its last significant dividend adjustment to ensure stability moving forward.
| Sector | Dividend Yield | Current Dividend per Share | Dividend History | Last Cut or Suspension |
|---|---|---|---|---|
| Utilities | 4.39% | $2.67 | 43 years | None |
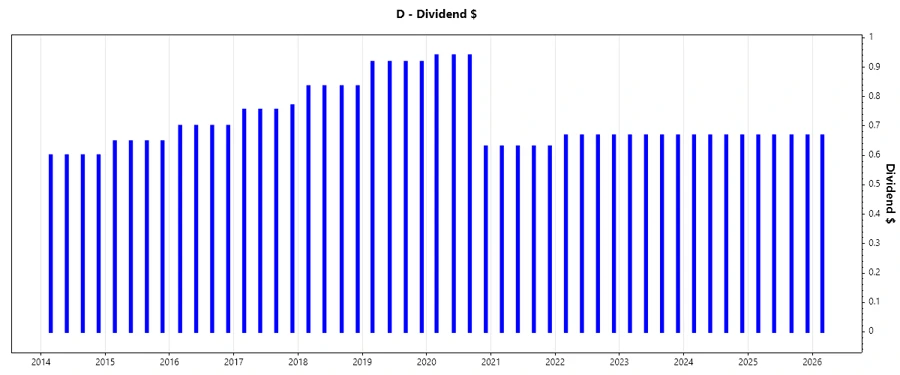
Dividend History
The company's extensive dividend history underscores a longstanding commitment to returning value to shareholders. This consistency is crucial for investors seeking reliable income streams, especially in volatile markets.
| Year | Dividend per Share (USD) |
|---|---|
| 2026 | 0.6675 |
| 2025 | 2.6700 |
| 2024 | 2.6700 |
| 2023 | 2.6700 |
| 2022 | 2.6700 |
Dividend Growth
The tracking of dividend growth is essential for long-term investors seeking to assess the sustainability of earnings and future income potential. Dominion Energy's recent growth trends present challenges, necessitating detailed scrutiny.
| Time | Growth |
|---|---|
| 3 years | 0% |
| 5 years | -5% |
The average dividend growth is -5% over 5 years. This indicates a need for strategic realignment to restore favorable growth trends.
Payout Ratio
Payout ratios offer insights into the sustainability of dividend distributions relative to earnings and cash flow measurements. Dominion Energy's EPS-based payout ratio exceeds 97%, highlighting financial pressures on dividend coverage.
| Key figure | Ratio |
|---|---|
| EPS-based | 97.33% |
| Free cash flow-based | -29.41% |
The high EPS payout ratio coupled with negative free cash flow coverage requires close monitoring, posing a potential risk to dividend continuation.
Cashflow & Capital Efficiency
Financial efficiencies lay the foundation for sustained dividend distributions. As such, they demand rigorous assessment to ensure the longevity of returns.
| Metric | 2024 | 2023 | 2022 |
|---|---|---|---|
| Free Cash Flow Yield | -16.39% | -9.69% | -8.03% |
| Earnings Yield | 4.70% | 5.28% | 2.61% |
| CAPEX to Operating Cash Flow | 2.48 | 1.56 | 2.10 |
| Stock-based Compensation to Revenue | 0 | 0 | 0 |
| Free Cash Flow / Operating Cash Flow Ratio | -1.48 | -0.56 | -1.10 |
Negative cash flow measures demand tactful management to not impair dividend viability.
Balance Sheet & Leverage Analysis
A robust balance sheet fortifies an enterprise against market tribulations, dictating its fiscal resilience over tumultuous periods.
| Metric | 2024 | 2023 | 2022 |
|---|---|---|---|
| Debt-to-Equity | 1.53 | 1.61 | 1.49 |
| Debt-to-Assets | 0.41 | 0.41 | 0.39 |
| Debt-to-Capital | 0.61 | 0.62 | 0.60 |
| Net Debt to EBITDA | 5.84 | 6.46 | 6.45 |
| Current Ratio | 0.71 | 1.04 | 0.73 |
| Quick Ratio | 0.52 | 0.97 | 0.62 |
| Financial Leverage | 3.76 | 3.96 | 3.79 |
The company's leverage metrics necessitate strategic interventions to secure fiscal stability amidst financial engagements.
Fundamental Strength & Profitability
Evaluating profitability metrics offers a lens through which financial efficacy is judged, crucial for enduring market competitiveness.
| Metric | 2024 | 2023 | 2022 |
|---|---|---|---|
| Return on Equity | 7.79% | 7.24% | 4.78% |
| Return on Assets | 2.07% | 1.83% | 1.26% |
| Margins: Net | 14.69% | 13.85% | 9.48% |
| Margins: EBIT | 28.14% | 25.67% | 23.39% |
| Margins: EBITDA | 46.39% | 47.40% | 45.72% |
| Margins: Gross | 47.87% | 48.34% | 45.75% |
| Research & Development to Revenue | 0 | 0 | 0 |
Efficient capital allocation and optimizing profitability ratios are central to augmenting shareholder gains.
Price Development
Dividend Scoring System
| Criteria | Score | |
|---|---|---|
| Dividend yield | 4 | |
| Dividend Stability | 3 | |
| Dividend growth | 2 | |
| Payout ratio | 2 | |
| Financial stability | 3 | |
| Dividend continuity | 4 | |
| Cashflow Coverage | 2 | |
| Balance Sheet Quality | 3 |
Overall Score: 23/40
Rating
Overall, Dominion Energy, Inc. manifests a dividend structure that is both robust yet encumbered by financial constraints. The notably high payout ratio and stagnation in dividend growth signal the necessity for fiscal recalibration to uphold its dividend promise. Investors should remain vigilant, anticipating strategic maneuvers to redress balance sheet leverage while sustaining income distribution. Recommended for cautious investors seeking stable yield amidst managed risk exposure.