January 13, 2026 a 12:47 pm

D: Dividend Analysis - Dominion Energy, Inc.
Dominion Energy, Inc. shows a robust dividend profile, characterized by a consistent history of dividend payments spanning over four decades. However, the growth has been stagnant in recent years, and a significant cut occurred in 2021. With a high dividend yield and payout ratio based on EPS, investors should carefully consider the sustainability of these payouts in the context of the company's cash flow challenges.
📊 Overview
Dominion Energy stands as a longstanding player in the Energy sector. The company offers an attractive dividend yield but recent historical performance raises questions about future growth potential.
| Metric | Value |
|---|---|
| Sector | Energy |
| Dividend yield | 4.56% |
| Current dividend per share | $2.67 |
| Dividend history | 42 years |
| Last cut or suspension | 2021 |
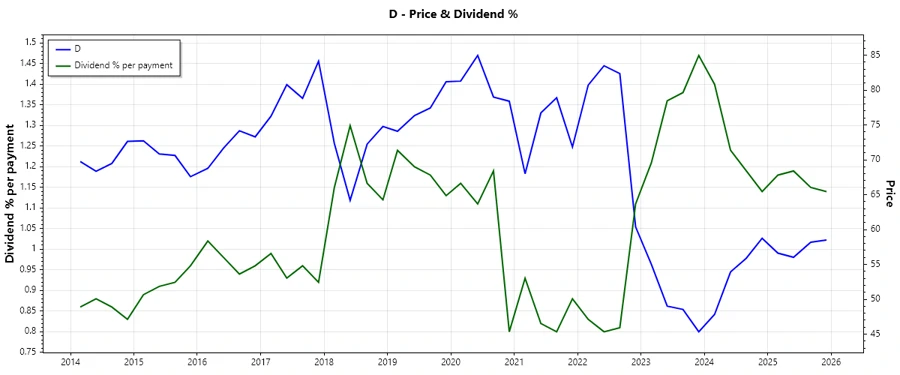
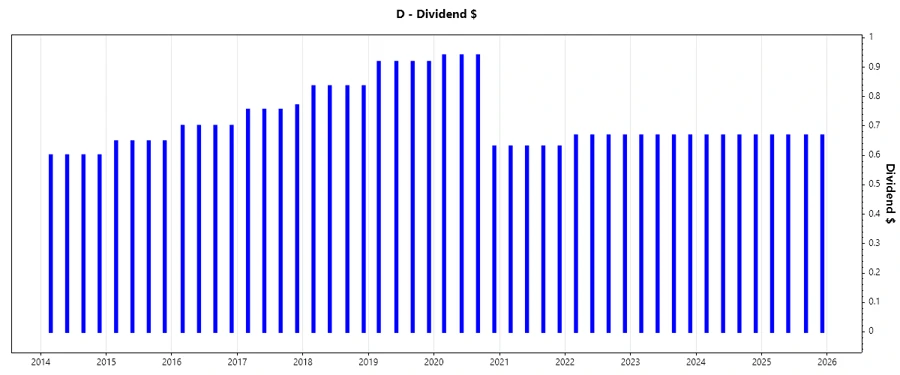
📈 Dividend History
The continuous dividend history is pivotal for income-focused investors. It reflects the company's dedication to returning profits to shareholders, which can be an essential component of total shareholder return over time.
| Year | Dividend per Share (USD) |
|---|---|
| 2025 | 2.67 |
| 2024 | 2.67 |
| 2023 | 2.67 |
| 2022 | 2.67 |
| 2021 | 2.52 |
📈 Dividend Growth
The dividend growth rate is a fundamental indicator of a company's ability to increase dividends in the future, reassuring investors of potential income growth.
| Time | Growth |
|---|---|
| 3 years | 0% |
| 5 years | -5.00% |
The average dividend growth is -5.00% over 5 years. This shows moderate but steady dividend declines.
⚠️ Payout Ratio
Payout ratios are essential to assess the sustainability of dividends. Hence, analyzing how much of its earnings a company pays out as dividends is important.
| Key figure ratio | Value |
|---|---|
| EPS-based | 97.33% |
| Free cash flow-based | -29.41% |
The EPS-based payout ratio of 97.33% is alarmingly high, indicating almost all earnings are distributed as dividends, which might be unsustainable. The negative FCF-based ratio further reinforces concerns about dividend durability.
🔍 Cashflow & Capital Efficiency
Analysis of cash flow and capital efficiency metrics is key to understanding the company's ability to generate cash and invest in growth.
| 2024 | 2023 | 2022 | |
|---|---|---|---|
| Free Cash Flow Yield | -16.39% | -9.69% | -8.03% |
| Earnings Yield | 4.70% | 5.28% | 2.61% |
| CAPEX to Operating Cash Flow | 2.48 | 1.56 | 2.10 |
| Stock-based Compensation to Revenue | 0% | 0% | 0% |
| Free Cash Flow / Operating Cash Flow Ratio | -1.48 | -0.56 | -1.10 |
The company's cash flow efficiency indicates significant issues, with negative free cash flow yield and poor cash flow conversion. It highlights potential constraints in funding dividends and investments.
📉 Balance Sheet & Leverage Analysis
Assessing leverage and financial health is crucial to understanding the risk profile and liquidity of the company.
| 2024 | 2023 | 2022 | |
|---|---|---|---|
| Debt-to-Equity | 1.53 | 1.61 | 1.49 |
| Debt-to-Assets | 0.41 | 0.41 | 0.39 |
| Debt-to-Capital | 0.61 | 0.62 | 0.60 |
| Net Debt to EBITDA | 5.84 | 6.46 | 6.45 |
| Current Ratio | 0.84 | 1.04 | 0.73 |
| Quick Ratio | 0.52 | 0.97 | 0.62 |
| Financial Leverage | 3.76 | 3.96 | 3.79 |
The company's high leverage ratios highlight elevated risk in its financial structure, pressuring liquidity and potentially impacting financial stability.
📋 Fundamental Strength & Profitability
Tracking profitability metrics helps investors comprehend operational efficiency and value creation capabilities of the company.
| 2024 | 2023 | 2022 | |
|---|---|---|---|
| Return on Equity | 7.79% | 7.24% | 4.78% |
| Return on Assets | 2.07% | 1.83% | 1.26% |
| Margins: Net | 14.69% | 13.85% | 9.48% |
| EBIT | 28.14% | 25.67% | 23.39% |
| EBITDA | 46.39% | 47.40% | 45.72% |
| Gross | 47.87% | 48.34% | 45.75% |
| Research & Development to Revenue | 0% | 0% | 0% |
The return metrics reflect healthy operational efficiency, though pressure on net margins needs continual monitoring for value preservation.
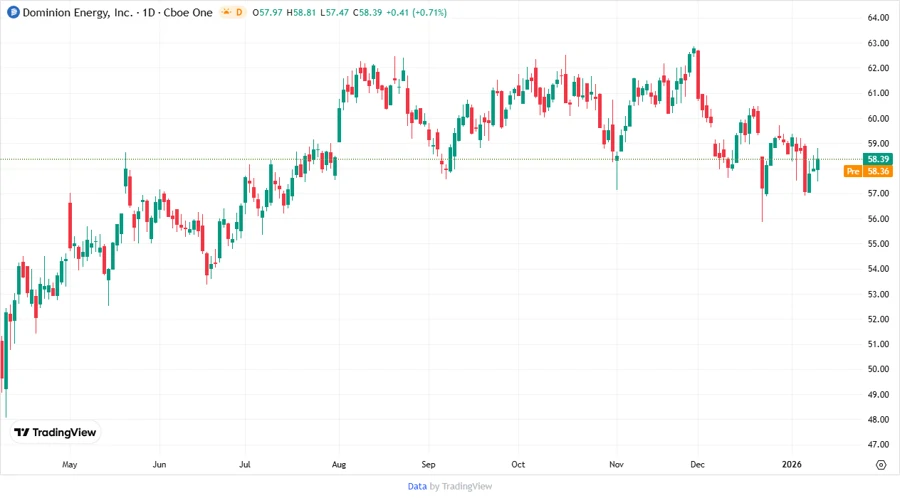
📈 Price Development
✅ Dividend Scoring System
| Category | Score | Rating |
|---|---|---|
| Dividend yield | 4/5 | |
| Dividend Stability | 3/5 | |
| Dividend growth | 2/5 | |
| Payout ratio | 3/5 | |
| Financial stability | 2/5 | |
| Dividend continuity | 3/5 | |
| Cashflow Coverage | 2/5 | |
| Balance Sheet Quality | 1/5 |
Total Score: 20/40
🗣️ Rating
Dominion Energy, Inc. exhibits a solid dividend yield and history but faces challenges with declining growth and high payout ratios. Investors seeking stable income may find it appealing, though risks from financial leverage and cash flow constraints warrant caution. Consider portfolio diversification to mitigate potential volatility impact.