December 24, 2025 a 07:46 am

📊 Dividend Analysis - Dominion Energy, Inc.
Dominion Energy, Inc. presents a mixed dividend profile with a high dividend yield of 4.57% and a long history of 42 years of dividend payments. However, recent years have shown challenges, particularly with a last dividend cut in 2021. Careful consideration of these dynamics is crucial for potential investors.
🔍 Overview
The overview assesses key dividend metrics that frame the financial landscape of Dominion Energy, Inc. Despite a long-standing tradition of dividends, the recent payout ratios pose red flags.
| Key Metric | Value |
|---|---|
| Sector | Utilities |
| Dividend Yield | 4.57 % |
| Current Dividend per Share | 2.67 USD |
| Dividend History | 42 years |
| Last Cut or Suspension | 2021 |
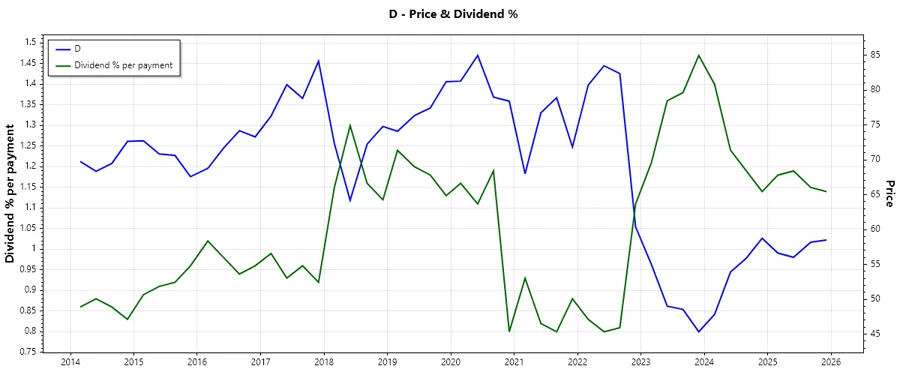
📉 Dividend History
The consistency of Dominion Energy’s dividend payments highlights stable cash-generating capability. However, the stability was disrupted in 2021, a crucial year indicating management's strategies under financial constraints.
| Year | Dividend per Share (USD) |
|---|---|
| 2025 | 2.67 |
| 2024 | 2.67 |
| 2023 | 2.67 |
| 2022 | 2.67 |
| 2021 | 2.52 |
📈 Dividend Growth
The growth dynamics present a complex picture. While there is slight recent growth, the longer-term decline may concern potential investors who prioritize growth.
| Time | Growth |
|---|---|
| 3 Years | 1.95 % |
| 5 Years | -6.16 % |
The average dividend growth is -6.16 % over 5 years. This shows a need for investors to remain cautious of long-term growth potential.
💡 Payout Ratio
The payout ratio is a critical financial metric that assesses the sustainability of dividends by comparing dividends per share to earnings. A high or negative payout ratio may indicate potential difficulty in maintaining current dividend levels.
| Key figure | Ratio |
|---|---|
| EPS-based | 97.32 % |
| Free Cash Flow-based | -148.81 % |
The payout ratios raise concern, particularly the FCF-based payout ratio, which indicates outflows exceeding inflows—potentially unsustainable over the long term.
📊 Cashflow & Capital Efficiency
Cash flow and capital efficiency are critical as they directly impact a company's ability to cover dividend payments. Analysis of recent financial figs suggests potential issues.
| Year | 2024 | 2023 | 2022 |
|---|---|---|---|
| Free Cash Flow Yield | -16.39% | -9.69% | -8.03% |
| Earnings Yield | 4.70% | 5.28% | 2.61% |
| CAPEX to Operating Cash Flow | 247.65% | 155.74% | 209.68% |
| Stock-based Compensation to Revenue | 0% | 0% | 0% |
| Free Cash Flow / Operating Cash Flow Ratio | -147.65% | -55.73% | -109.68% |
The figures present a challenging scenario for Dominion Energy's cash flow and capital efficiency, marked by negative cash flow yield and high CAPEX to operating cash flow.
🏦 Balance Sheet & Leverage Analysis
This analysis focuses on the financial stability and leverage of the company, impacting strategic decisions and dividend security.
| Year | 2024 | 2023 | 2022 |
|---|---|---|---|
| Debt-to-Equity | 1.53 | 1.61 | 1.49 |
| Debt-to-Assets | 0.41 | 0.41 | 0.39 |
| Debt-to-Capital | 0.61 | 0.62 | 0.60 |
| Net Debt to EBITDA | 6.18 | 6.46 | 6.45 |
| Current Ratio | 0.71 | 1.04 | 0.73 |
While the balancing sheet ratios suggest significant leverage, careful analysis of the coverage abilities is essential, taking leverage ratios into particular account.
📈 Fundamental Strength & Profitability
This section analyzes fundamental profitability and return measures critical for shareholders assessing growth potential and financial health.
| Year | 2024 | 2023 | 2022 |
|---|---|---|---|
| Return on Equity | 7.79% | 7.24% | 4.78% |
| Return on Assets | 2.07% | 1.83% | 1.26% |
| Margins: Net, EBIT, EBITDA, Gross | 14.69%, 28.14%, 46.39%, 47.87% | 13.85%, 25.67%, 47.40%, 48.34% | 9.48%, 23.39%, 45.72%, 45.75% |
| Research & Development to Revenue | 0% | 0% | 0% |
The fundamentals are varied with strong margins, yet high leverage and poor asset returns decreasing overall attractiveness as an investment.
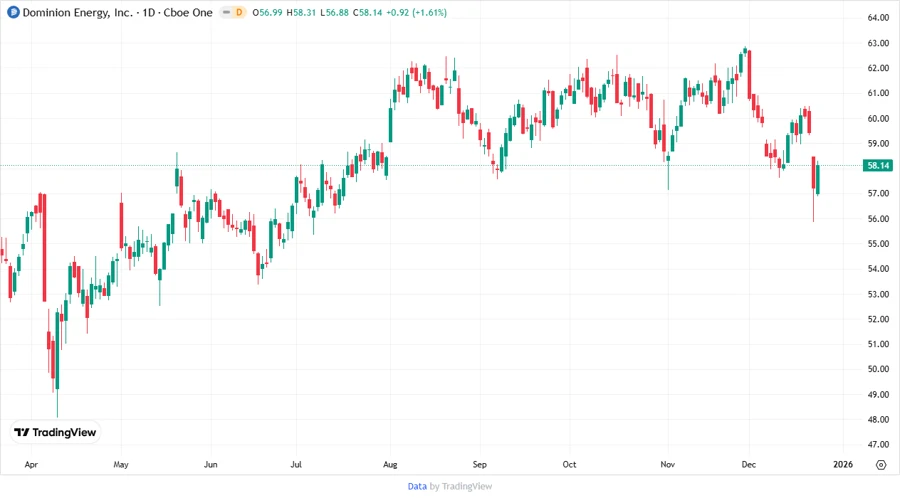
📉 Price Development
✅ Dividend Scoring System
| Category | Score (1-5) | Score Bar |
|---|---|---|
| Dividend yield | 4 | |
| Dividend Stability | 3 | |
| Dividend growth | 2 | |
| Payout ratio | 2 | |
| Financial stability | 3 | |
| Dividend continuity | 4 | |
| Cashflow Coverage | 2 | |
| Balance Sheet Quality | 3 |
Total Score: 23/40
🏆 Rating
Dominion Energy, Inc. posits a mixed dividend outlook, with notable strengths in yield and continuity but overshadowed by weak growth and potential payout sustainability issues. It’s a cautious 'Hold' for portfolios, considering potential improvements in cash flow and balance stability.