December 07, 2025 a 12:46 pm


📊 Dividend Analysis - Dominion Energy, Inc.
Dominion Energy, Inc. presents a solid case for income-seeking investors. With a consistent dividend history of 42 years, the company is recognized for its reliability, despite a past dividend cut in 2021. While the dividend yield of 4.56% is quite attractive, investors should be cognizant of the recent payout challenges reflected in the high EPS payout ratio. Nonetheless, Dominion's focus on sustainable energy solutions could pave the way for future growth.
Overview 📈
Dominion Energy operates within the sector, showcasing its long-standing commitment to providing stable and reliable dividends. Here is a snapshot of their dividend metrics:
| Metric | Data |
|---|---|
| Sector | Energy |
| Dividend Yield | 4.56% |
| Current Dividend Per Share | $2.67 |
| Dividend History | 42 years |
| Last Cut or Suspension | 2021 |
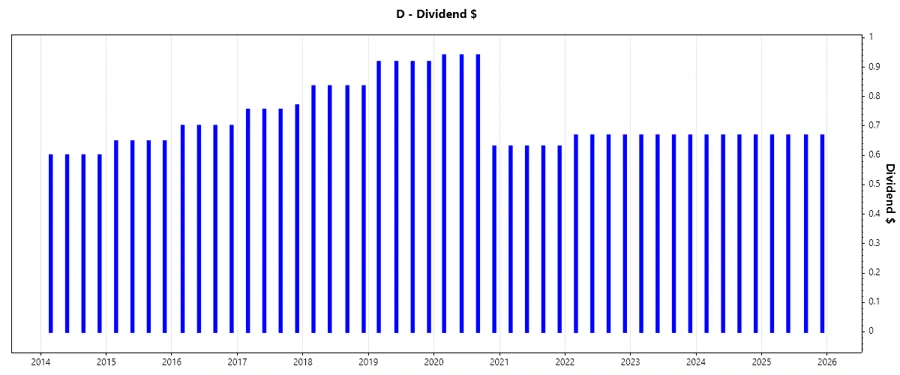
Dividend History 📉
Dominion Energy's dividend history underscores its resilience, though it faced a reduction in 2021. This history is significant as it reflects the company's ability to weather market fluctuations while striving to maintain investor returns.
The chart below outlines recent dividend payouts:
| Year | Dividend Per Share (USD) |
|---|---|
| 2025 | $2.67 |
| 2024 | $2.67 |
| 2023 | $2.67 |
| 2022 | $2.67 |
| 2021 | $2.52 |
Dividend Growth 📈
Examining dividend growth is crucial for assessing a company's future payout potential. Dominion shows a 3-year growth rate of 0.02%, while the 5-year growth depicts a negative trend of -6.16%, indicating a need for cautious optimism when forecasting future growth.
| Time | Growth |
|---|---|
| 3 years | 0.02% |
| 5 years | -6.16% |
The average dividend growth is -6.16% over 5 years. This shows moderate but steady dividend growth.
Payout Ratio ⚠️
The payout ratio indicates how sustainable a dividend is based on earnings and free cash flow. Dominion's high EPS payout of 97.32% suggests a potential risk in maintaining current payout levels, especially given the negative free cash flow payout.
| Key Figure | Ratio |
|---|---|
| EPS-based | 97.32% |
| Free cash flow-based | -148.81% |
The payout indicates that earnings are stretched, and the negative FCF-based payout warns of liquidity strains.
Cashflow & Capital Efficiency 🧮
Cash flow analysis is essential for assessing liquidity and capital efficiency. Dominion demonstrates challenges in generating positive cash flows, which are crucial for sustaining dividends.
| Metric | 2024 | 2023 | 2022 |
|---|---|---|---|
| Free Cash Flow Yield | -16.39% | -9.69% | -8.03% |
| Earnings Yield | 4.70% | 5.28% | 2.61% |
| CAPEX to Operating Cash Flow | 2.48 | 1.56 | 2.10 |
| Stock-based Compensation to Revenue | 0 | 0 | 0 |
| Free Cash Flow/Operating Cash Flow Ratio | -1.48 | -0.56 | -1.10 |
While earnings yields remain positive, the negative free cash flow yields pose significant challenges for capital reinvestment and payout sustainability.
Balance Sheet & Leverage Analysis 📊
An evaluation of the balance sheet highlights Dominion's leverage and liquidity posture. The debt-to-equity ratio illustrates a substantial reliance on debt.
| Metric | 2024 | 2023 | 2022 |
|---|---|---|---|
| Debt-to-Equity | 1.53 | 1.61 | 1.49 |
| Debt-to-Assets | 0.41 | 0.41 | 0.39 |
| Debt-to-Capital | 0.61 | 0.62 | 0.60 |
| Net Debt to EBITDA | 6.18 | 6.46 | 6.45 |
| Current Ratio | 0.71 | 1.04 | 0.73 |
| Quick Ratio | 0.52 | 0.97 | 0.62 |
| Financial Leverage | 3.76 | 3.96 | 3.79 |
The leverage ratios depict a high degree of financial risk, raising caution regarding debt management effectiveness.
Fundamental Strength & Profitability 📈
Analyzing fundamental strength helps gauge overall financial health. Dominion’s profitability ratios show modest returns.
| Metric | 2024 | 2023 | 2022 |
|---|---|---|---|
| Return on Equity | 7.79% | 7.24% | 4.78% |
| Return on Assets | 2.07% | 1.83% | 1.26% |
| Margins - Net | 14.69% | 13.85% | 9.48% |
| EBIT | 28.14% | 25.67% | 23.39% |
| EBITDA | 46.39% | 47.40% | 45.72% |
| Gross | 47.87% | 48.34% | 45.75% |
| R&D to Revenue | 0 | 0 | 0 |
While margins are relatively stable, return on equity remains below industry benchmarks, signaling room for operational improvement.
Price Development 📈
Dividend Scoring System ✅
The scoring system evaluates Dominion Energy's dividend potential across several fiscal attributes.
| Criterion | Score | Score Bar |
|---|---|---|
| Dividend Yield | 4 | |
| Dividend Stability | 3 | |
| Dividend Growth | 2 | |
| Payout Ratio | 2 | |
| Financial Stability | 2 | |
| Dividend Continuity | 3 | |
| Cashflow Coverage | 2 | |
| Balance Sheet Quality | 3 |
Total Score: 21/40
Rating 🗣️
Dominion Energy's dividend outlook is mixed, with stable yields but challenges in growth and payout sustainability. Investors should monitor financial developments, considering both risks and resilience factors. Cautiously optimistic, investors might find value in Dominion's long-term market position and sectoral strengths.