November 09, 2025 a 03:31 am

D: Dividend Analysis - Dominion Energy, Inc.
Dominion Energy, Inc. presents an intricate dividend profile backed by decades of historical consistency. With a strong market capitalization and a commitment to steady payouts, the company has captured the attention of dividend-focused investors. However, recent adjustments to dividend growth indicate a cautious approach towards future distributions. This analysis evaluates the company’s dividend strategy, financial health, and market positioning.
📊 Overview
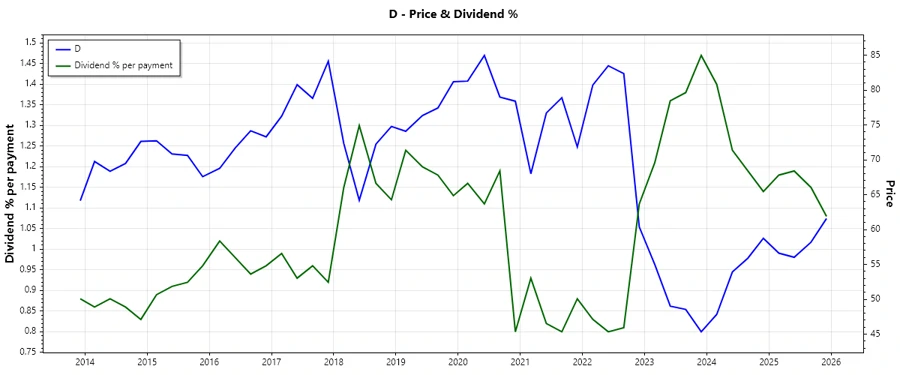
In the utility sector, Dominion Energy exhibits a current dividend yield of 4.34% with a dividend history of 42 years, reflecting strong investor confidence. However, a suspension noted in 2021 raises questions on prospective dividend sustainability.
| Metric | Value |
|---|---|
| Sector | Utilities |
| Dividend yield | 4.34% |
| Current dividend per share | 2.67 USD |
| Dividend history | 42 years |
| Last cut or suspension | 2021 |
🗣️ Dividend History
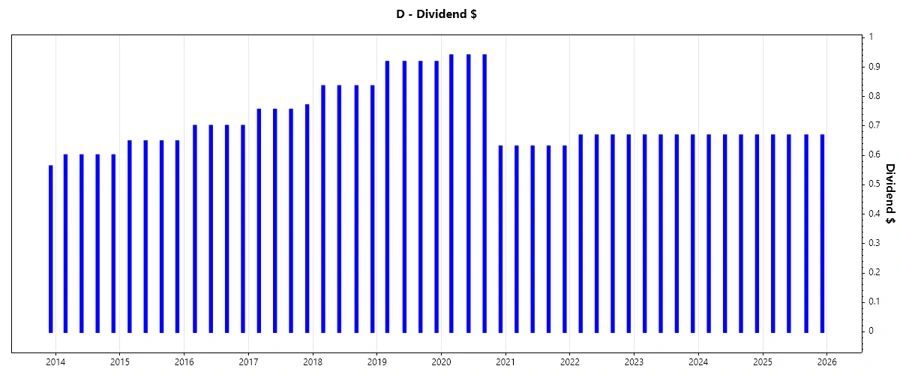
Dominion Energy maintains a longstanding tradition of dividend distributions. Despite the historical cut in 2021, dividends have realigned with preceding amounts, evidencing resilience. Ensuring shareholder satisfaction through consistent payouts signals the company's prioritization of investor returns, fostering long-term trust.
| Year | Dividend per Share (USD) |
|---|---|
| 2025 | 2.67 |
| 2024 | 2.67 |
| 2023 | 2.67 |
| 2022 | 2.67 |
| 2021 | 2.52 |
📈 Dividend Growth
The dividend growth rate over the last 3 years has been a modest 1.95%, while the 5-year rate reflects a decline of 6.16%. This reduction in growth highlights the company's strategic shifts, possibly in response to macroeconomic challenges, impacting its distributable income and necessitating prudent financial strategies.
| Time | Growth |
|---|---|
| 3 years | 1.95% |
| 5 years | -6.16% |
The average dividend growth is -6.16% over 5 years. This shows moderate but steady dividend growth.
⚠️ Payout Ratio
The payout ratios are key indicators of dividend sustainability. With an EPS-based payout ratio of 97.32% and a negative free cash flow-based ratio, Dominion Energy may face challenges in maintaining its current dividend levels without adjustments to profitability or capital management strategies.
| Key figure | Ratio |
|---|---|
| EPS-based | 97.32% |
| Free cash flow-based | -148.81% |
The high EPS payout ratio and negative FCF-based payout ratio point towards potential unsustainability under current operational terms, necessitating close monitoring and possible corrective measures.
✅ Cashflow & Capital Efficiency
Dominion Energy’s cash flow and capital efficiency reveal critical insights into operational and financial health. The free cash flow stability is concerning, with negative yields in recent years, while the earnings yield remains modest yet positive.
| Metric | 2024 | 2023 | 2022 |
|---|---|---|---|
| Free Cash Flow Yield | -16.39% | -9.69% | -8.03% |
| Earnings Yield | 4.70% | 5.28% | 2.61% |
| CAPEX to Operating Cash Flow | 132.16% | 55.74% | 109.68% |
| Stock-based Compensation to Revenue | 0.00% | 0.00% | 0.00% |
| Free Cash Flow / Operating Cash Flow Ratio | -147.65% | -55.74% | -109.68% |
With current cash flow metrics under stress, Dominion Energy must optimize its capital allocations to achieve better ROI and ensure adequate liquidity for sustaining shareholder returns.
🏦 Balance Sheet & Leverage Analysis
The balance sheet and leverage metrics highlight the company's financial structure. With high debt ratios and moderate liquidity, financial prudence is essential to manage leverage-related risks and maintain solvency.
| Metric | 2024 | 2023 | 2022 |
|---|---|---|---|
| Debt-to-Equity | 1.53 | 1.61 | 1.49 |
| Debt-to-Assets | 40.77% | 40.58% | 39.32% |
| Debt-to-Capital | 60.50% | 61.64% | 59.83% |
| Net Debt to EBITDA | 6.18 | 6.46 | 6.45 |
| Current Ratio | 0.71 | 1.04 | 0.73 |
| Quick Ratio | 0.52 | 0.97 | 0.62 |
| Financial Leverage | 3.76 | 3.96 | 3.79 |
These leverage metrics indicate critical reliance on debt in the capital structure, which might limit operational flexibility without adequate liquidity ratios.
📉 Fundamental Strength & Profitability
Analyzing fundamental strength and profitability through key metrics like ROE, ROA, and various margins:
| Metric | 2024 | 2023 | 2022 |
|---|---|---|---|
| Return on Equity | 7.79% | 7.24% | 4.78% |
| Return on Assets | 2.07% | 1.83% | 1.26% |
| Net Margin | 14.69% | 13.85% | 9.48% |
| EBIT Margin | 28.14% | 25.67% | 23.39% |
| EBITDA Margin | 46.39% | 47.40% | 45.72% |
| Gross Margin | 47.87% | 48.34% | 45.75% |
Strong margins and returns demonstrate Dominion’s operational efficacy, although improvements in asset utilization and net margin are key to enhancing overall financial performance.
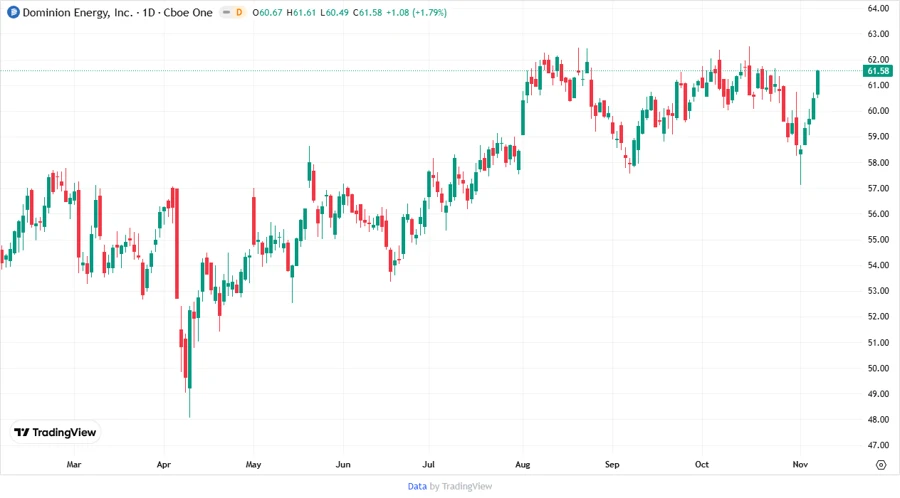
📈 Price Development
🎯 Dividend Scoring System
| Category | Score | Score Bar |
|---|---|---|
| Dividend yield | 4 | |
| Dividend Stability | 3 | |
| Dividend growth | 2 | |
| Payout ratio | 1 | |
| Financial stability | 3 | |
| Dividend continuity | 4 | |
| Cashflow Coverage | 2 | |
| Balance Sheet Quality | 3 |
Total Score: 22/40
🔍 Rating
Dominion Energy, Inc. offers a mixed dividend profile, characterized by historical dependability but challenged by recent growth reductions and high payout ratios. The company’s financial framework underscores the necessity for strategic refinements to uphold dividend sustainability. Overall, investment consideration should weigh these factors against individual risk tolerance and long-term income objectives.
Smart Data Insight
Master the Perfect Entry & Exit for this Stock
Don't leave your profits to chance. Historically, this stock follows specific seasonal patterns that institutional traders use to maximize returns.
- ✅ Identify the "Golden Buying Window"
- ✅ Avoid high-risk correction cycles
- ✅ Backtested data from the last 20+ years