October 20, 2025 a 11:31 am


📊 Dividend Analysis - Dominion Energy, Inc.
Dominion Energy, Inc., a prominent player in the utility sector, boasts a robust dividend history spanning over four decades. Despite economic challenges, the company has maintained a resilient dividend yield, providing shareholders with consistent income. However, a recent analysis indicates a stagnation in dividend growth, raising questions about future policy adjustments. The comprehensive analysis below navigates through the historical and current financial metrics, offering insights into the company's dividend landscape and its sustainability.
Overview
Dominion Energy operates in the Utilities sector, providing power and energy solutions. Its dividend strategy has been a cornerstone of investor attraction, with a current yield of 4.59% and a dividend history of 42 years. Despite the longstanding history, there have been recent concerns owing to a lack of significant dividend growth. Below is a summary of its core dividend metrics.
| Key Metrics | Values |
|---|---|
| Sector | Utilities |
| Dividend yield | 4.59% |
| Current dividend per share | $2.67 |
| Dividend history | 42 years |
| Last cut or suspension | None |
Dividend History
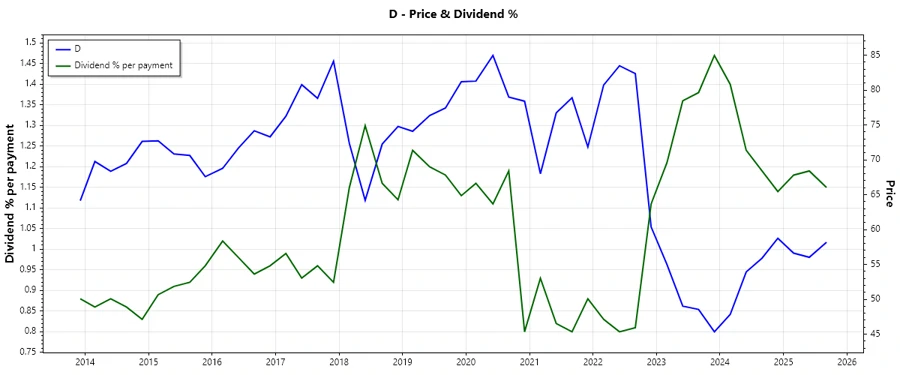
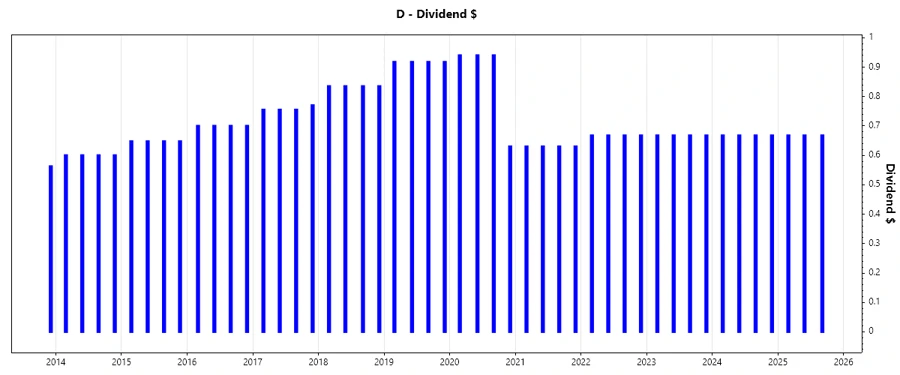
Dominion Energy has exhibited a strong dividend history with no recent suspensions, fostering investor confidence. The stability over decades overshadows the modest reduction in dividend payment in 2025. A historical view of dividends helps understand risk and performance in varying market conditions.
| Year | Dividend per Share (USD) |
|---|---|
| 2025 | 2.00 |
| 2024 | 2.67 |
| 2023 | 2.67 |
| 2022 | 2.67 |
| 2021 | 2.52 |
Dividend Growth
The growth of dividends over a period is crucial for evaluating the company's capability to enhance shareholder value. Dominion Energy's 5-year dividend growth rate of -6.16% signals a contraction, attributable to strategic realignments within the company, despite market dynamics promoting increment.
| Time | Growth |
|---|---|
| 3 years | 1.95% |
| 5 years | -6.16% |
The average dividend growth is -6.16% over 5 years. This shows moderate but steady concerns about dividend growth.
Payout Ratio
The payout ratio is pivotal in assessing the sustainability of dividend payments. An EPS-based payout of 99.55% indicates potential stress points, while negative FCF-based payout showcases operational shifts impacting free cash generation.
| Key Figure | Ratio |
|---|---|
| EPS-based | 99.55% |
| Free cash flow-based | -28.03% |
These figures suggest a high payout relative to earnings, whereas negative free cash flow indicates a requirement for strategic adjustments to maintain dividend levels.
Cashflow & Capital Efficiency
An analysis of cash flow and capital efficiency addresses the critical capabilities of generating and utilizing cash strategically. With a negative Free Cash Flow Yield, there's a heightened focus on efficient capital allocation and corrective strategic initiatives.
| Financial Metric | 2022 | 2023 | 2024 |
|---|---|---|---|
| Free Cash Flow Yield | -8.03% | -9.69% | -16.39% |
| Earnings Yield | 2.61% | 5.28% | 4.70% |
| CAPEX to Operating Cash Flow | 209.68% | 155.74% | 247.65% |
| Stock-based Compensation to Revenue | 0% | 0% | 0% |
| Free Cash Flow / Operating Cash Flow Ratio | -109.68% | -55.74% | -147.65% |
| Return on Invested Capital | 1.16% | 2.82% | 2.86% |
Cash flow volatility is apparent, suggesting a need for operational efficiency enhancements to sustain capital allocation strategies.
Balance Sheet & Leverage Analysis
The leverage and balance sheet metrics provide insights into financial health and risk management. A Debt-to-Equity of over 1.5 across years indicates substantial leverage, impacting financial stability considerations.
| Financial Metric | 2022 | 2023 | 2024 |
|---|---|---|---|
| Debt-to-Equity | 1.49 | 1.61 | 1.53 |
| Debt-to-Assets | 0.39 | 0.41 | 0.41 |
| Debt-to-Capital | 0.60 | 0.62 | 0.61 |
| Net Debt to EBITDA | 6.45 | 6.46 | 6.18 |
| Current Ratio | 0.73 | 1.04 | 0.71 |
| Quick Ratio | 0.62 | 0.97 | 0.52 |
| Financial Leverage | 3.79 | 3.96 | 3.76 |
The balance sheet structure faces scrutiny due to increased leverage, emphasizing a review of liability management strategies.
Fundamental Strength & Profitability
Assessing profitability and fundamental strength provides insights into the firm's financial health and operational success. While margins are moderate, Returns and Earnings Yields indicate suboptimal performance in capital utilization.
| Financial Metric | 2022 | 2023 | 2024 |
|---|---|---|---|
| Return on Equity | 4.78% | 7.24% | 7.79% |
| Return on Assets | 1.26% | 1.83% | 2.07% |
| Net Margin | 9.48% | 13.85% | 14.69% |
| EBIT Margin | 23.39% | 25.67% | 28.14% |
| EBITDA Margin | 46.32% | 47.40% | 46.39% |
| Gross Margin | 45.75% | 48.34% | 47.87% |
| Research & Development to Revenue | 0% | 0% | 0% |
Profit margins and returns denote adherence to moderate profitability; however, there lies potential to optimize efficiency and maximize strategic growth.
Price Development
Dividend Scoring System
An internal scoring system evaluates Dominion Energy's dividend metrics against industry benchmarks.
| Category | Score (1-5) | Score Bar |
|---|---|---|
| Dividend yield | 4 | |
| Dividend Stability | 4 | |
| Dividend growth | 2 | |
| Payout ratio | 3 | |
| Financial stability | 3 | |
| Dividend continuity | 4 | |
| Cashflow Coverage | 2 | |
| Balance Sheet Quality | 3 |
Total Score: 25/40
Rating
🗣️ Dominion Energy, Inc., holds a resilient position in dividend offerings despite periodic challenges. The company reflects solid dividend stability, though strategic realignments are suggested to enhance growth prospects. Investors may view this as a moderate investment with potential adjustments underway to boost long-term returns.
Smart Data Insight
Master the Perfect Entry & Exit for this Stock
Don't leave your profits to chance. Historically, this stock follows specific seasonal patterns that institutional traders use to maximize returns.
- ✅ Identify the "Golden Buying Window"
- ✅ Avoid high-risk correction cycles
- ✅ Backtested data from the last 20+ years