May 13, 2026 a 09:03 am
DXCM: Trend and Support & Resistance Analysis - DexCom, Inc.
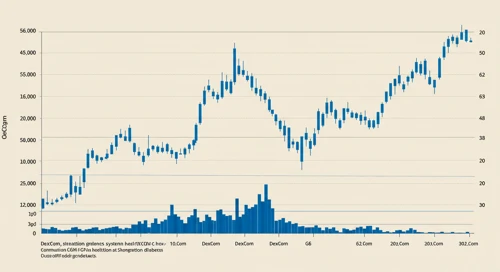
DexCom, Inc. is a prominent player in the continuous glucose monitoring market, providing vital technology for diabetes management. With a significant market presence, the company is poised to capitalize on the ever-growing healthcare technology demand. Analyzing the stock trend and key support and resistance zones provides insights into investment opportunities and potential risks. While technical indicators point to varying trends, understanding the broader market and industry dynamics remains crucial for informed decisions.
Trend Analysis
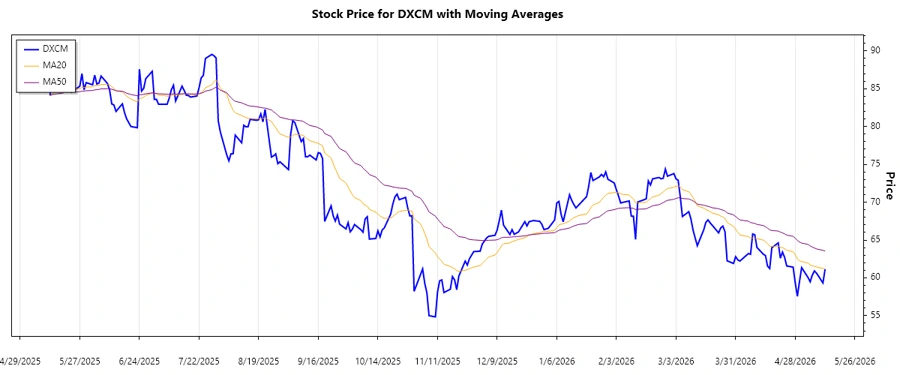
Over the analyzed period, the trend has seen a transition with diverse movements. Using the exponential moving averages, the current trend can be further evaluated. Let's delve into the recent data:
| Date | Closing Price | Trend |
|---|---|---|
| 2026-05-12 | 61.14 | ▼ Abwärtstrend |
| 2026-05-11 | 59.33 | ▼ Abwärtstrend |
| 2026-05-08 | 60.61 | ▼ Abwärtstrend |
| 2026-05-07 | 60.91 | ▼ Abwärtstrend |
| 2026-05-06 | 60.36 | ▼ Abwärtstrend |
| 2026-05-05 | 59.48 | ▼ Abwärtstrend |
| 2026-05-04 | 60.04 | ▼ Abwärtstrend |
The EMA calculations indicate a prevailing downtrend with EMA20 falling below EMA50. This highlights potential bearish conditions, suggesting caution to investors.
Support and Resistance
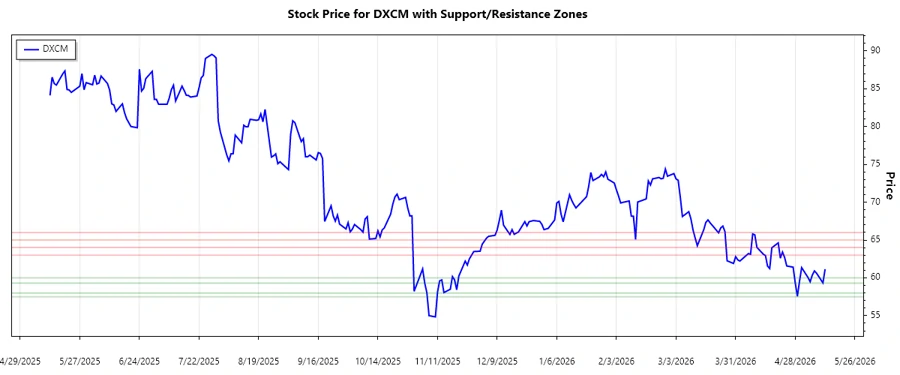
In evaluating support and resistance zones, fluctuations are evident. These critical levels can assist in strategic trading decisions:
| Zone Type | From | To |
|---|---|---|
| Support | 60.00 | 59.30 |
| Support | 57.50 | 58.00 |
| Resistance | 63.00 | 64.00 |
| Resistance | 65.00 | 66.00 |
Currently, the price is just above the first support zone, allowing for potential stabilization. Analysts should closely watch these levels for longer-term positioning strategies.
Conclusion
DexCom, Inc.'s stock exhibits a downward trend, indicated by the EMA analysis. Investors should tread cautiously as the company faces defined resistance zones. However, its position near support levels may provide buying opportunities if there's a bounce. Continued monitoring of industry dynamics and stock performance is advisable for optimized strategic decisions.
Smart Data Insight
Master the Perfect Entry & Exit for this Stock
Don't leave your profits to chance. Historically, this stock follows specific seasonal patterns that institutional traders use to maximize returns.
- ✅ Identify the "Golden Buying Window"
- ✅ Avoid high-risk correction cycles
- ✅ Backtested data from the last 20+ years