February 05, 2026 a 06:44 am
DXCM: Fibonacci Analysis - DexCom, Inc.
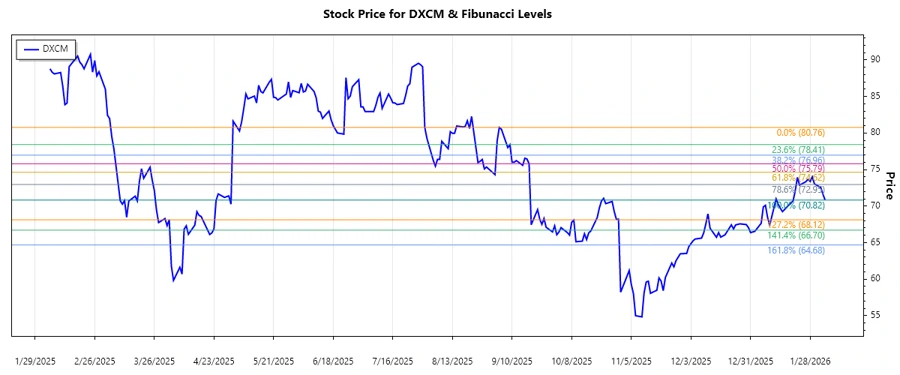
The analysis of DexCom, Inc. stock reveals a significant downtrend from September 2025 to February 2026. This trend is crucial for traders using technical analysis to make informed decisions, as the downward movement presents potential opportunities for buying at lower levels once the trend shows signs of reversal. DexCom's role in the CGM market for diabetes management continues to keep its stock under a dynamic environment, influencing its pricing patterns. As the company expands its portfolio and market presence, stock volatility is expected to continue. Careful analysis of trends and retracement levels remains essential for potential investors.
Fibonacci Analysis
| Parameter | Details |
|---|---|
| Trend Start Date | 2025-09-04 |
| Trend End Date | 2026-02-04 |
| High Point | Date: 2025-09-04, Price: 80.76 |
| Low Point | Date: 2026-02-04, Price: 70.82 |
| Fibonacci Levels |
|
| Current Price | 70.82 |
| Retracement Zone | 0.618 |
| Interpretation | The stock is currently in the 0.618 retracement zone, which may act as a potential support level, suggesting a possibility for a rebound if buying interest increases. |
Conclusion
The current downward trend of DexCom, Inc. shares poses both challenges and opportunities for market participants. While the substantial decline in prices may concern some investors, it also opens possibilities for others to enter at favorable levels. With its technology in diabetes management continuing to gain traction, the long-term prospects appear favorable, provided the company maintains innovation and market leadership. Awareness of support and resistance levels, as indicated by the Fibonacci analysis, will be key for strategic entry or exit. Given the stock's responsiveness to market dynamics, analysts should continue to closely monitor developments to better assess risk-reward scenarios.