November 12, 2025 a 10:15 am

DXCM: Fibonacci Analysis - DexCom, Inc.
DexCom, Inc. has shown significant price movements over recent months. As a leading player in the medical device market, specializing in diabetes management systems, the company's stock performance is closely watched by investors. Despite some volatility, the dominant trend observed indicates an opportunity for potential future growth as the market responds to DexCom's innovative offerings.
Fibonacci Analysis
| Analysis Period | High Point | Low Point |
|---|---|---|
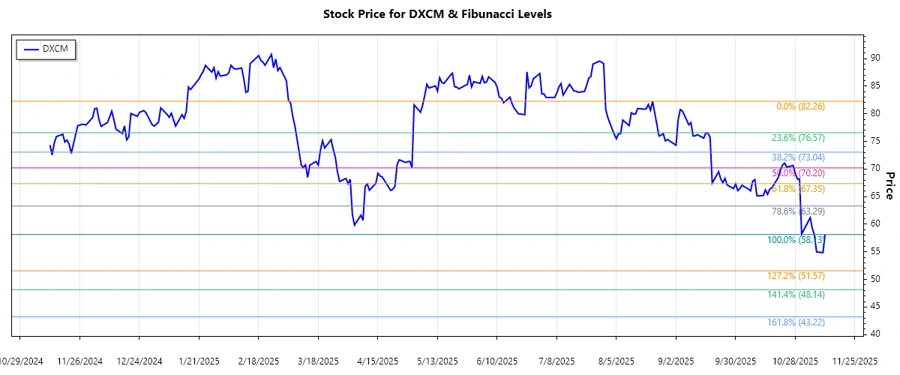
| 2025-08-22 to 2025-11-11 | $82.26 on 2025-08-22 | $58.13 on 2025-11-11 |
| Fibonacci Level | Price Level |
|---|---|
| 0.236 | $65.25 |
| 0.382 | $68.06 |
| 0.5 | $70.20 |
| 0.618 | $72.34 |
| 0.786 | $75.03 |
The current price of $58.13 is below the 0.236 Fibonacci retracement level, indicating the stock is in a strong downtrend without any significant retracement so far.
Technical interpretation suggests that unless the price breaks above the 0.236 level, there could be continued pressure on the stock, with the possibility of using the identified Fibonacci levels as future resistance points.
Conclusion
The analysis of DexCom, Inc.'s recent stock trends suggests cautious optimism. While the stock is currently in a downturn, as indicated by the below 0.236 Fibonacci level price, the company's strong presence in the CGM market could provide a foundation for potential recovery. Investors should consider the low price as an entry opportunity but remain vigilant for further technical signals of support or resistance that align with broader market dynamics.
Smart Data Insight
Master the Perfect Entry & Exit for this Stock
Don't leave your profits to chance. Historically, this stock follows specific seasonal patterns that institutional traders use to maximize returns.
- ✅ Identify the "Golden Buying Window"
- ✅ Avoid high-risk correction cycles
- ✅ Backtested data from the last 20+ years